Mô tả
📈 Stochastic RSI
Chỉ báo Stochastic RSI là một bộ dao động động lượng áp dụng công thức Stochastic cho các giá trị RSI thay vì giá, làm cho nó trở thành một chỉ báo đạo hàm bậc hai. Nó đặc biệt hữu ích để xác định các điều kiện mua quá mức và bán quá mức với độ nhạy cao hơn so với RSI tiêu chuẩn.
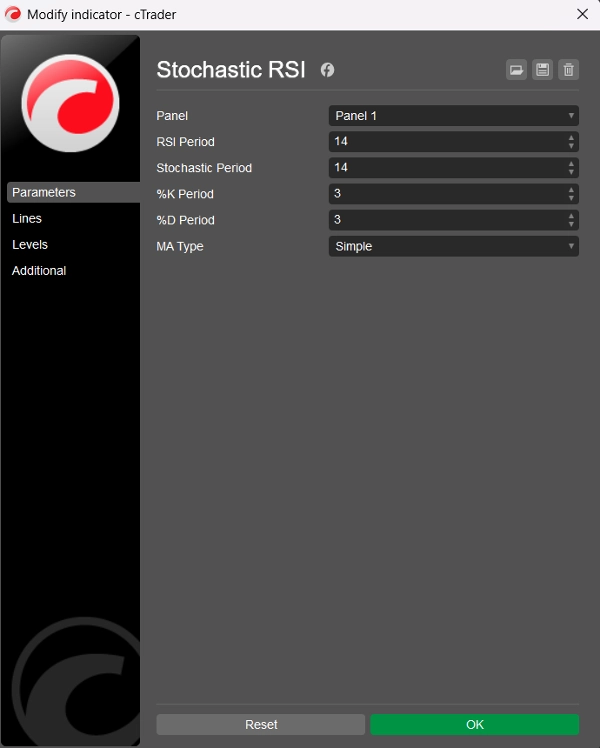
🛠️ Tham số
Chu kỳ RSI: Khoảng thời gian nhìn lại được sử dụng để tính RSI cơ bản (mặc định = 14)
Chu kỳ Stochastic: Khoảng thời gian nhìn lại áp dụng cho các giá trị RSI để tính Stochastic RSI (mặc định = 14)
Chu kỳ %K: Khoảng thời gian làm mượt cho đường %K (mặc định = 3)
Chu kỳ %D: Khoảng thời gian làm mượt cho đường %D (mặc định = 3)
Loại MA: Loại trung bình động để làm mượt: Lựa chọn 11 loại (mặc định = Đơn giản)
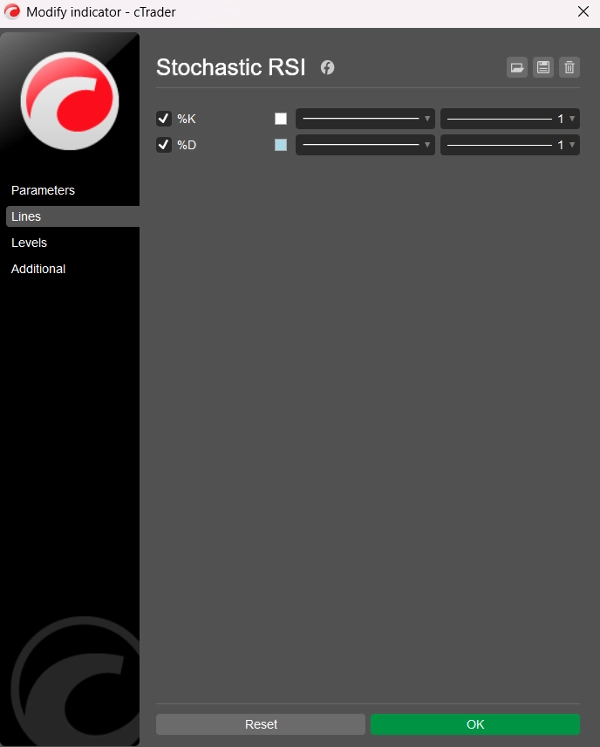
📊 Đường đầu ra
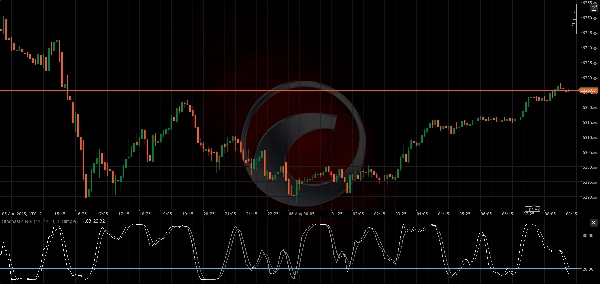
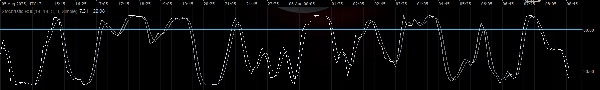
- Đường %K: Stochastic RSI đã được làm mượt (màu trắng)
- Đường %D: Trung bình động đã làm mượt của %K (màu xanh nhạt)
Cả hai đường dao động giữa 0 và 100, cho phép đọc rõ các tín hiệu mua quá mức và bán quá mức.
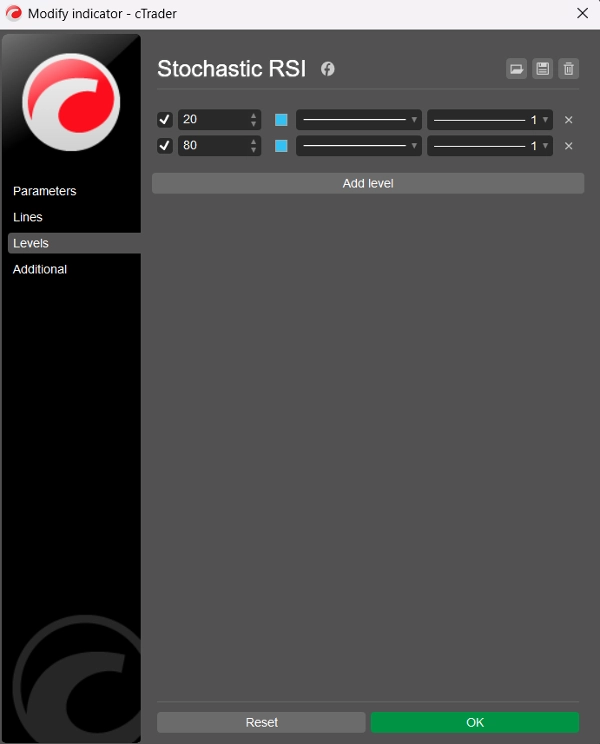
⚠️ Mức đề xuất
Mặc dù chỉ báo không hiển thị các mức tĩnh theo mặc định, người dùng được khuyến nghị thêm chúng thủ công qua tab “Levels” trong cTrader:
- Mức 80 → Mua quá mức
- Mức 20 → Bán quá mức
Những mức này hoạt động tương tự như Bộ dao động Stochastic truyền thống nhưng áp dụng cho hành vi RSI, làm cho các tín hiệu sắc nét hơn và thường nhanh hơn.
🧠 Cách sử dụng
- Mua quá mức (>80): Có thể chỉ ra giá đã tăng quá mức — có khả năng đảo chiều hoặc tích lũy.
- Bán quá mức (<20): Có thể báo hiệu giá bị bán quá mức — khả năng bật lên hoặc đảo chiều xu hướng.
- Giao cắt %K và %D: Có thể sử dụng tương tự như Stochastic hoặc MACD — giao cắt tăng dưới 20 hoặc giao cắt giảm trên 80 có thể là tín hiệu hành động.
🏷️ Ghi chú
- Được xây dựng cho cTrader sử dụng C# và API Automate
- Sạch sẽ, hiệu quả và có thể tùy chỉnh với 11 loại MA
- Mã và logic bởi BlueRocketBots & ChatGPT (OpenAI)
- Mã sạch (tổng 99 dòng; 54 dòng mã, 27 dòng văn bản, 18 dòng trống)
- Phiên bản cải tiến V2
- Miễn phí!
Tóm tắt
Key parameters include the RSI Period (default 14), Stochastic Period (default 14), %K and %D smoothing periods (default 3 each), and a choice among 11 moving average types for smoothing (default is Simple). The indicator outputs two lines: the %K line (smoothed Stochastic RSI) and the %D line (smoothed moving average of %K), both oscillating between 0 and 100.
Suggested manual levels for interpretation are 80 (overbought) and 20 (oversold). Traders may use these levels along with %K and %D crossovers to identify potential price reversals or consolidations. For example, a bullish crossover below 20 or a bearish crossover above 80 can signal actionable market moves.
The indicator is implemented in clean, efficient C# code using the Automate API, allowing customization and integration within cTrader.