
50 percent
Chỉ báo
Phiên bản 1.0, Aug 2025
Windows, Mac
5.0
Đánh giá: 2

Mô tả
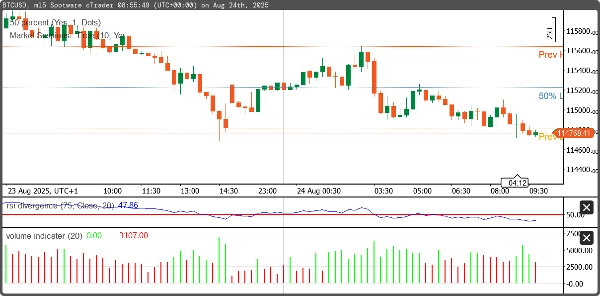
cBot này tự động phát hiện giá cao và thấp của phiên trước và tính toán điểm giữa giữa chúng. Nó được thiết kế để hỗ trợ các nhà giao dịch bằng cách xác định các vùng hỗ trợ/kháng cự chính và các mức cân bằng thị trường, thường được sử dụng cho các chiến lược đảo chiều hoặc phá vỡ.
- Phát hiện giá cao và thấp của ngày (hoặc phiên) trước.
- Tính toán điểm giữa giữa giá cao và thấp.
- Vẽ các mức giá cao, thấp và điểm giữa trên biểu đồ.
Tóm tắt
Hồ sơ chỉ báo
Đánh giá của khách hàng
5.0
Đánh giá: 2
5 | 100 % | |
4 | 0 % | |
3 | 0 % | |
2 | 0 % | |
1 | 0 % |
Đánh giá của khách hàng
August 29, 2025
The screen feels less crowded, but the final call still needs say no.
August 20, 2025
Thảo luận
Câu hỏi thường gặp
Các sản phẩm có sẵn trên cTrader Store, bao gồm bot giao dịch, chỉ báo và plugin, được cung cấp bởi các nhà phát triển bên thứ ba và chỉ nhằm mục đích cung cấp thông tin và tiếp cận kỹ thuật. cTrader Store không phải là nhà môi giới và không cung cấp lời khuyên đầu tư, khuyến nghị cá nhân hay bất kỳ đảm bảo nào về hiệu suất trong tương lai.
Sản phẩm khác của tác giả này


Giá
Kể từ 14/05/2025
10.1M
Khối lượng đã giao dịch
81.44K
Pip đạt được
205
Cài đặt miễn phí