Mô tả
🚀 Biến Đổi Giao Dịch Renko Của Bạn Với Hiển Thị Đuôi Nến Chính Xác
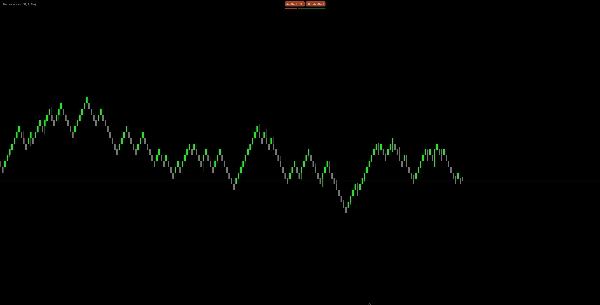
Mở Khóa Dữ Liệu Thị Trường Ẩn Mà Biểu Đồ Renko Tiêu Chuẩn Không Hiển Thị! 📈
✨ Điều Gì Làm Cho Chỉ Báo Này Đặc Biệt?
🎯 Phân Tích Mức Tick Thực Sự - Khác với các chỉ báo khác chỉ đoán, công cụ này phân tích từng tick riêng lẻ trong mỗi viên gạch Renko để tiết lộ cực giá thực tế đã xảy ra trong quá trình hình thành.
🔍 Xem Những Gì Người Khác Bỏ Lỡ - Khám phá các mức cao và thấp thực sự đã xảy ra bên trong mỗi viên gạch Renko, cung cấp cho bạn những hiểu biết quan trọng về thị trường để quyết định vào và thoát lệnh tốt hơn.
💪 Các Tính Năng Chính Nổi Bật:
🏗️ Công Nghệ Lưu Trữ Cục Bộ Thông Minh
- Tự động lưu tất cả các đuôi nến đã tính toán vào bộ nhớ cục bộ của bạn
- Không bao giờ mất dữ liệu - ngay cả khi chuyển đổi biểu đồ, khung thời gian hoặc khởi động lại cTrader
- Tải dữ liệu tăng dần thông minh ngăn chặn việc tính toán lại dữ liệu đã có
- Tác động hiệu suất tối thiểu khi khởi động lại nền tảng
⚡ Hiệu Suất Nhanh Chóng
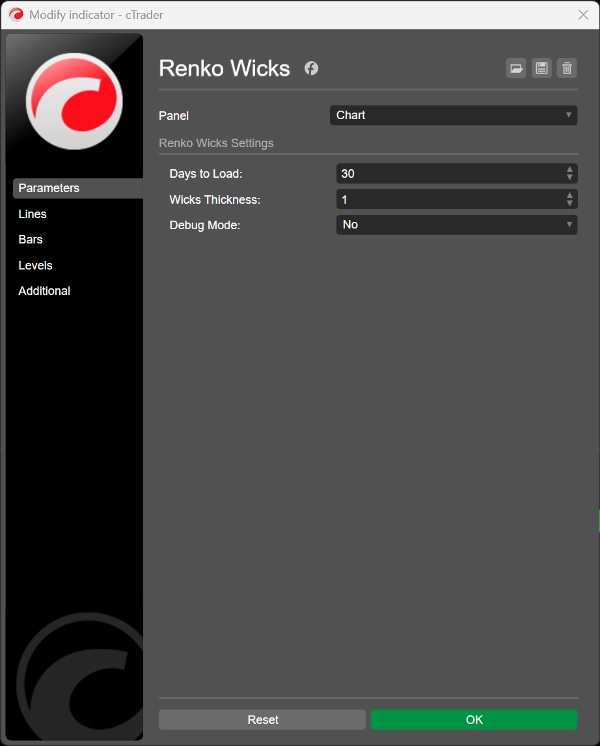
- Tải dần từng ngày với hiển thị tiến trình thời gian thực
- Độ sâu lịch sử có thể cấu hình (1+ ngày)
- Tối ưu hóa sử dụng bộ nhớ để vận hành biểu đồ mượt mà
🎨 Thiết Kế Hình Ảnh Chuyên Nghiệp
- Tự động phù hợp với bảng màu tăng/giảm của biểu đồ bạn
- Độ dày đuôi nến có thể điều chỉnh (1-5 pixel) để hiển thị hoàn hảo
- Hiển thị sạch sẽ, không gây cản trở giúp nâng cao phân tích của bạn
🛡️ Độ Tin Cậy Vững Chắc
- Dữ Liệu Bền Bỉ 100% - Đuôi nến của bạn tồn tại qua các lần khởi động lại nền tảng, chuyển đổi biểu đồ và thay đổi khung thời gian
- Ngăn chặn trùng lặp thông minh đảm bảo biểu đồ sạch sẽ
- Xử lý lỗi tích hợp để ổn định tối đa
- Chế độ gỡ lỗi cho sự minh bạch và khắc phục sự cố
🎯 Phù Hợp Cho:
📊 Nhà Giao Dịch Trong Ngày - Nhận biết các cực điểm trong ngày để có cơ hội scalping chính xác
📈 Nhà Giao Dịch Swing - Xác định các mức hỗ trợ/kháng cự chính trong các viên gạch Renko
🔄 Phân Tích Nhiều Khung Thời Gian - Mỗi khung thời gian duy trì cơ sở dữ liệu đuôi nến riêng
🚨 Tại Sao Đuôi Nến Renko Quan Trọng:
Biểu đồ Renko tiêu chuẩn chỉ hiển thị giá mở và đóng của mỗi viên gạch, nhưng các biến động giá lớn xảy ra ở giữa! Chỉ báo này tiết lộ:
- 📉 Mức hỗ trợ/kháng cự thực sự nơi giá thực sự chạm tới
- 🎪 Thông tin về biến động thị trường trong mỗi quá trình hình thành viên gạch
- 🎯 Điểm vào/ra tốt hơn dựa trên các cực giá thực tế
- 📊 Phân tích cấu trúc thị trường nâng cao để đưa ra quyết định sáng suốt
Được tạo bởi một nhà giao dịch renko thực thụ ♥
Tóm tắt
Key features include smart local storage that preserves calculated wick data across chart switches, timeframes, and platform restarts, ensuring data persistence and minimizing recalculations. The indicator offers fast, progressive day-by-day data loading with configurable history depth and optimized memory usage for smooth performance. Visually, it adapts to the chart’s bull/bear color scheme and allows adjustable wick thickness for clear, non-intrusive display.
Renko Wicks Pro supports multiple timeframes, maintaining separate wick databases for each, making it suitable for day traders seeking precise scalping points and swing traders identifying key levels. It includes built-in error handling, duplicate prevention, and a debug mode for stability and troubleshooting.
By revealing hidden price movements within Renko bricks, this indicator aids in identifying true market structure, improving entry and exit decisions based on actual price extremes.