
Daily TPO profile
Chỉ báo
213 lượt tải
Phiên bản 1.0, Nov 2025
Windows, Mac
Mô tả
Hồ sơ TPO hàng ngày
Chỉ báo hồ sơ TPO hàng ngày tính toán POC, VAH và VAL cho mỗi phiên.
Vẽ Điểm Kiểm Soát và Khu Vực Giá Trị 70% trực tiếp trên biểu đồ, giúp bạn xác định các vùng giá hợp lý, các mức hỗ trợ/kháng cự chính và các khu vực tiềm năng của sự từ chối hoặc chấp nhận giá.
Cách hoạt động
Chỉ báo này xây dựng một hồ sơ TPO (Cơ hội Giá theo Thời gian) hàng ngày, tương tự như Hồ sơ Thị trường.
Đối với mỗi thanh trong ngày giao dịch, nó:
- chia trục giá thành các “bước” cố định được xác định bởi “Kích thước Hàng (pips)”
- đối với mỗi bước giá, đếm có bao nhiêu thanh chạm mức đó (TPO = số lần giá giao dịch ở đó)
- vào cuối ngày nó tính toán:
-
- POC (Điểm Kiểm Soát) → mức giá có số lượng TPO cao nhất (nơi thị trường dành nhiều thời gian nhất)
- VAH (Giá Trị Khu Vực Cao) và VAL (Giá Trị Khu Vực Thấp) → các mức giá chứa khoảng Phần trăm Khu Vực Giá Trị (mặc định 70%) của tất cả TPO trong phiên đó
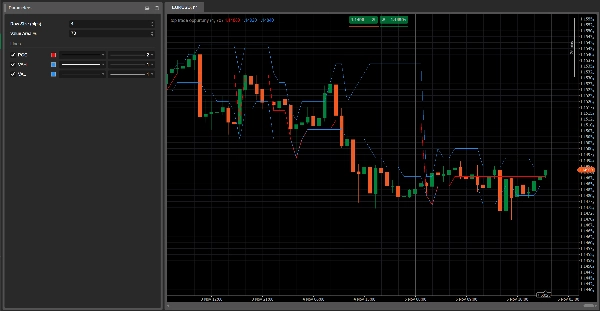
Chỉ báo vẽ ba đường ngang trên biểu đồ:
- Đường màu đỏ → POC
- Đường màu xanh → VAH (trên) và VAL (dưới)
Các đường này được cập nhật từng thanh trong phiên và được đặt lại khi bắt đầu ngày giao dịch mới.
Các tham số chính
Kích thước Hàng (pips)
Xác định độ dày của mỗi bước giá trong hồ sơ.-
- Giá trị nhỏ hơn = hồ sơ chi tiết hơn
- Giá trị lớn hơn = hồ sơ mượt mà hơn
Phần trăm Khu Vực Giá Trị
Phần trăm tổng số TPO nằm trong Khu Vực Giá Trị (thường là 70%).
Khu Vực Giá Trị là vùng giá mà phần lớn hoạt động thị trường diễn ra trong ngày.
Cách đọc
- POC (đường đỏ)
-
- Mức giá được thị trường “chấp nhận” nhiều nhất trong ngày đó.
- Thường đóng vai trò như một mức cân bằng: giá có thể bật lại, dừng hoặc phá vỡ mạnh quanh vùng này.
- Khu Vực Giá Trị (VAH–VAL, đường xanh)
-
- Biểu thị vùng “giá trị hợp lý” nơi phần lớn giao dịch diễn ra.
- Hành động giá so với VAH/VAL có thể cho thấy:
-
- Sự từ chối của các mức giá cực đoan (phá vỡ giả vượt qua VAH/VAL)
- Sự chấp nhận các mức giá mới (tích lũy bên ngoài Khu Vực Giá Trị)
Ý tưởng sử dụng điển hình
- Giá từ chối VAL và di chuyển trở lại bên trong Khu Vực Giá Trị → ý tưởng mua tiềm năng, đặt cược vào sự trở lại “giá trị hợp lý” (quay về trung bình).
- Giá phá vỡ trên VAH với sức mạnh và bắt đầu xây dựng cấu trúc phía trên → khả năng bắt đầu một khu vực giá trị cao hơn mới (kịch bản theo xu hướng).
- Nhiều ngày với các POC quanh cùng một mức → vùng cân bằng/tích lũy mạnh, thường là hỗ trợ/kháng cự chính.
Tóm tắt
Tóm tắt AI
The Daily TPO Profile indicator constructs a daily Time Price Opportunity (TPO) profile similar to a Market Profile, analyzing market activity by price levels throughout each trading session. It divides the price axis into fixed increments ("Row Size" in pips) and counts how many bars traded at each price step, representing TPOs. At the end of the session, it calculates three key levels: the Point of Control (POC), where the market spent the most time; the Value Area High (VAH); and the Value Area Low (VAL), which together define the price range containing approximately 70% of the trading activity.
The indicator plots these levels as horizontal lines on the chart—POC in red, VAH and VAL in blue—updating them bar by bar during the session and resetting daily. Traders use the POC as an equilibrium price level that may act as support or resistance. The Value Area highlights fair value zones, with price action near VAH and VAL signaling potential rejection or acceptance of price extremes. Typical applications include identifying mean reversion opportunities when price rejects VAL or trend-following setups when price breaks above VAH.
Main adjustable parameters include Row Size (pips), controlling profile detail, and Value Area %, defining the percentage of TPOs included in the value area. The indicator supports analysis across various markets including forex, indices, commodities, stocks, and cryptocurrencies.
Hồ sơ chỉ báo
Đánh giá của khách hàng
0.0
Đánh giá: 0
Đánh giá của khách hàng
Sản phẩm này chưa có đánh giá nào. Bạn đã dùng thử chưa? Hãy là người đầu tiên chia sẻ với mọi người!
Thảo luận
Câu hỏi thường gặp
Signal
Indices
Commodities
GBPUSD
RSI
Bollinger
Fibonacci
Scalping
AI
XAUUSD
NAS100
MACD
BTCUSD
Forex
Breakout
EURUSD
NZDUSD
Martingale
Prop
ZigZag
Supertrend
Fair Value Gap
SMC
Crypto
Grid
Stocks
ATR
USDJPY
VWAP
Các sản phẩm có sẵn trên cTrader Store, bao gồm bot giao dịch, chỉ báo và plugin, được cung cấp bởi các nhà phát triển bên thứ ba và chỉ nhằm mục đích cung cấp thông tin và tiếp cận kỹ thuật. cTrader Store không phải là nhà môi giới và không cung cấp lời khuyên đầu tư, khuyến nghị cá nhân hay bất kỳ đảm bảo nào về hiệu suất trong tương lai.


Giá
42.11M
Khối lượng đã giao dịch
6.13M
Pip đạt được
222
Lượt bán
8.4K
Cài đặt miễn phí