
Zero Lag Exponential Moving Average
指标
258 下载
版本 1.0, Aug 2025
Windows 版、Mac 版
说明
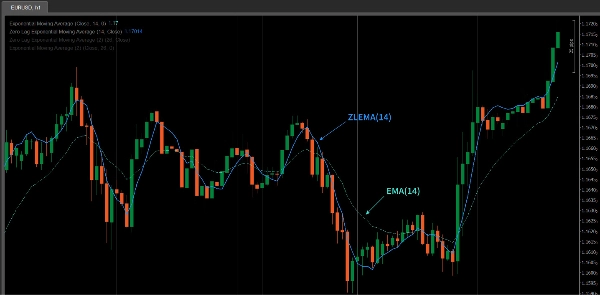
ZLEMA(零滞后指数移动平均线)是指数移动平均线(EMA)的高级版本,旨在减少传统EMA常见的滞后。通过使用专门的计算方法,ZLEMA对价格变化反应更快,使其在波动性较大的市场中尤为有效。
ZLEMA的关键特征是其“零滞后”特性,使其能够更紧密地跟踪价格走势,特别是在快速变化的市场条件下。与传统EMA相比,ZLEMA响应速度更快,更及时地捕捉市场趋势。
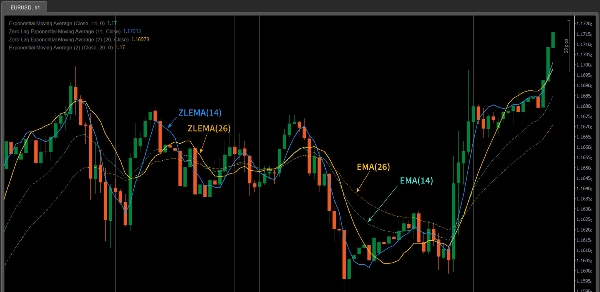
ZLEMA与EMA的比较
- 响应速度:ZLEMA比传统EMA反应更快。通过补偿滞后,它能更及时地跟踪价格变化。
- 平滑效果:ZLEMA保持了类似EMA的平滑效果,同时最大限度地减少价格滞后,使其更适合快速变化的市场。
- 使用场景:如果您在高度波动的市场中交易(如短期或日内交易),ZLEMA在响应速度方面优于EMA。
ZLEMA指标的特点
- 零滞后响应:ZLEMA减少滞后,使其能够快速响应市场价格波动,更准确地捕捉快速的市场变化。
- 平滑性:尽管响应更快,ZLEMA仍保留了EMA的平滑效果,有助于避免价格波动引起的噪音。
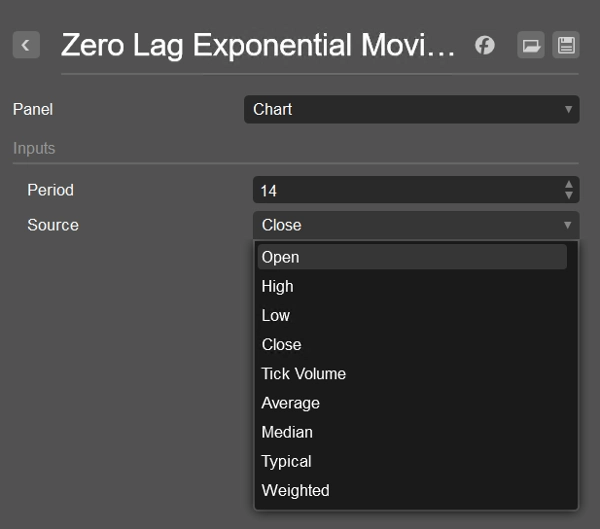
- 灵活性:ZLEMA可以使用不同的价格数据来源(例如
收盘价、开盘价、最高价等),允许交易者根据策略需求进行调整。 - 趋势跟踪与反转信号确认:ZLEMA非常适合识别趋势变化,尤其是在波动性市场中,并确认价格反转信号。
如何使用ZLEMA指标
- 短期交易者:ZLEMA非常适合短期交易者,因为它能快速响应价格波动。其快速反应使其理想于捕捉短期趋势反转或突破信号。
- 趋势跟踪:ZLEMA也可用于跟踪长期趋势,但比EMA更敏感。在强劲趋势中,ZLEMA有助于更快识别趋势的开始或结束,辅助及时调整策略。
- 与其他指标结合使用:ZLEMA与其他技术指标如RSI、MACD或价格形态分析结合使用时,能提高信号准确性。尤其是与趋势跟踪指标如移动平均线结合,确认价格突破或反转信号时非常有用。
- 确认突破和反转:ZLEMA有助于确认关键水平的价格突破或反转信号。例如,当价格穿越ZLEMA线时,可能表示趋势变化,反之亦然。
- 噪音减少:由于滞后减少,ZLEMA更善于过滤传统移动平均线中可能存在的噪音,是日内交易或高度波动市场中的重要工具。
使用ZLEMA的建议
- 调整周期:根据您的交易风格和市场波动性调整ZLEMA的周期。短期交易使用较短周期(例如10或14),而长期趋势跟踪则可使用较长周期(例如50或100)。
- 与其他工具结合:虽然ZLEMA提供了出色的趋势跟踪能力,但结合RSI(用于超买/超卖状态)或MACD(用于趋势强度)等其他指标可提高准确性。
- 测试与优化:ZLEMA的表现可能因市场条件不同而异。建议在实盘交易前进行充分的回测和优化,以确保策略效果最佳。
摘要
AI 摘要
The Zero Lag Exponential Moving Average (ZLEMA) is an advanced technical indicator designed to improve upon the traditional Exponential Moving Average (EMA) by reducing lag. It achieves faster response times to price changes while maintaining the smoothing effect of EMA, making it suitable for capturing quick market shifts and trends, especially in volatile or fast-moving markets.
Key features include:
- Zero lag response for timely reaction to price fluctuations.
- Smoothness that filters out noise without sacrificing responsiveness.
- Flexibility to use various price data inputs such as Close, Open, or High prices.
- Utility in trend following and confirming reversal signals.
ZLEMA is particularly useful for short-term traders seeking to capture rapid trend reversals or breakouts, as well as for longer-term trend tracking with enhanced sensitivity compared to EMA. It can be combined with other indicators like RSI or MACD to improve signal accuracy and confirm price breakouts or reversals.
Users can adjust the indicator’s period to match their trading style and market conditions, optimizing performance through backtesting. ZLEMA helps reduce noise and lag, making it a valuable tool for intraday and volatile market trading.
指标配置
客户评价
0.0
评价:0
客户评价
该产品尚无评价。已经试过了?抢先告诉其他人!
讨论
常见问答
cTrader Store 提供的所有产品,包括交易机器人、指标和插件,均由第三方开发者提供,仅供信息参考和技术访问之用。cTrader Store 并非经纪商,不提供投资建议、个人推荐或任何未来业绩保证。
猜您喜欢


价格
注册日期 14/07/2025
258
免费安装