说明
📌 功能与特性
- 布林带(20周期简单移动平均线,标准差为2)
-
- 上轨: 表示超买水平。
- 下轨: 表示超卖水平。
- 相对强弱指数(RSI)(14周期)
-
- RSI 高于70 → 市场处于 超买 状态(买入压力过大)。
- RSI 低于30 → 市场处于 超卖 状态(卖出压力过大)。
- 检测反转区域:
-
- 红色区域(超卖):
-
- 收盘价低于下轨布林带。
- RSI 低于30(卖压强烈)。
- 含义: 市场处于超卖状态,潜在买入机会。
- 绿色区域(超买):
-
- 收盘价高于上轨布林带。
- RSI 高于70(买压强烈)。
- 含义: 市场处于超买状态,潜在卖出机会。
- 可视化图表标记:
-
- 红色阴影区域 表示 超卖(潜在买入机会)。
- 绿色阴影区域 表示 超买(潜在卖出机会)。
- 提醒与声音信号:
-
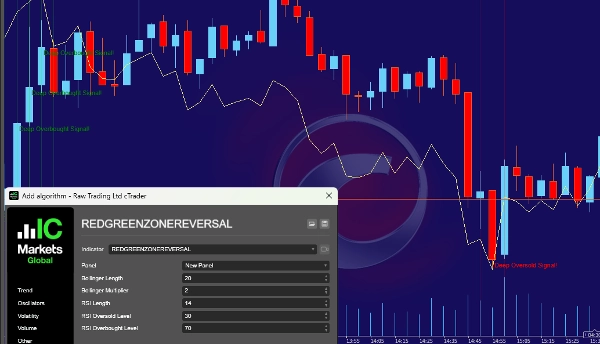
- 图表上显示文本(“深度超卖信号!”或“深度超买信号!”)。
- 检测到超买/超卖状态时播放声音通知。
🎯 这个指标如何帮助交易者?
✅ 提供潜在市场反转的警告信号(在极端价格水平)。
✅ 帮助交易者找到强有力的进出场点。
✅ 结合布林带和RSI 实现 可靠的 超买/超卖检测。
✅ 适用于日内交易、波段交易和剥头皮交易 在不同时间框架上。
🚀 总结:
该指标帮助 识别超买和超卖状态 并提醒 价格反转可能发生。交易者可以利用此信息 做出明智的买卖决策!
🚨 交易风险免责声明 🚨
交易金融工具,包括股票、外汇、加密货币、商品和衍生品,涉及高风险,并不适合所有投资者。在进行任何形式的交易之前,必须了解相关风险,仔细考虑您的财务状况、经验和风险承受能力。
市场可能高度波动,价格变动可能因经济数据发布、地缘政治事件、市场情绪或突发新闻而突然且不可预测。这种波动可能带来可观收益,但也可能导致重大损失。市场可能迅速逆转您的持仓,止损和风险管理策略不能保证避免损失,杠杆可能放大收益和损失,甚至超过您的初始投资。
没有任何交易策略、技术指标或方法能保证盈利。历史表现不代表未来结果,过去的成功不保证未来收益。即使是专业交易者也会遭受损失,市场状况不断变化,无法确定地预测未来走势。交易绝不应仅基于猜测或情绪。
使用杠杆或保证金交易允许您以较小的资金控制更大的仓位,但这也显著增加了风险。杠杆可能导致资金迅速亏损,保证金追缴可能迫使您以不利价格平仓,保证金交易可能导致亏损超过初始存款。此外,流动性风险和滑点可能发生,意味着在某一时刻买卖双方不足,订单可能无法按预期价格执行。市场跳空可能导致价格突然跳跃,完全绕过止损水平。
交易需要纪律、耐心和情绪控制。恐惧、贪婪和过度自信常导致糟糕的交易决策,增加亏损可能性。情绪化交易可能导致冲动和非理性决策,而害怕错过机会(FOMO)和报复性交易可能导致过度冒险。制定明确策略并坚持风险管理计划至关重要。
还必须考虑监管和法律风险,不同司法管辖区对交易和投资有不同规定。一些金融产品可能在您的国家不可用,监管变化可能影响市场状况。务必确保遵守当地法律和金融法规,与信誉良好且受监管的经纪商或交易所交易,避免可能带来重大财务风险的无监管平台。
技术相关风险不可忽视,交易高度依赖交易平台、互联网连接和软件执行。因网络缓慢或服务器问题导致的延迟执行可能造成意外损失,系统故障可能导致持仓比预期时间更长,使用在线交易平台存在网络安全风险。
重要的是,所有交易信息、指标、信号或工具仅供教育用途,不应视为财务建议。交易者应自行研究,如有必要,咨询持牌财务顾问后再做投资决策。没有任何指标或策略能保证持续盈利,所有交易决策的责任完全由个人交易者承担。
交易最重要的规则是永远不要用你无法承受损失的钱进行交易。交易本质上具有风险,亏损可能超过初始投资。只用可支配收入进行交易,切勿使用借来的资金或生活必需费用,并通过分散投资避免将所有资金投入单一交易或资产。
交易是一项高风险活动,不应依赖其作为主要收入来源。许多交易者亏损,只有少数能实现长期盈利。做出明智决策,管理风险,并始终负责任地交易。使用任何交易平台、工具或指标,即表示您已知晓并接受交易相关风险。
负责任地交易。保持信息灵通。保护您的资本。🚀
摘要
- Red Zone (Oversold): Closing price below the lower Bollinger Band and RSI below 30, signaling strong selling pressure and a potential buying opportunity.
- Green Zone (Overbought): Closing price above the upper Bollinger Band and RSI above 70, indicating strong buying pressure and a potential selling opportunity.
Visual markers include red-shaded zones for oversold conditions and green-shaded zones for overbought conditions. Alerts are provided via on-chart text notifications ("Deep Oversold Signal!" or "Deep Overbought Signal!") and sound signals when these conditions occur.
This tool assists traders by providing warning signals for potential market reversals at extreme price levels, helping to identify strong entry and exit points. It is suitable for various trading styles, including day trading, swing trading, and scalping, across different timeframes. The indicator supports markets such as forex, stocks, indices, and commodities.
客户评价
5 | 100 % | |
4 | 0 % | |
3 | 0 % | |
2 | 0 % | |
1 | 0 % |


!["[Stellar Strategies] Smart ADX" 标识](https://cdn.ctrader.com/image/webp/af13b084-b6f6-41db-b7bc-c7e688b57b05_36929)