
Dark Cloud Cover 指标是一种技术分析工具,旨在识别市场中潜在的看跌反转形态。该形态由两个连续的蜡烛图组成:
- 一根看涨(绿色)蜡烛,表示强劲的买入动能。
- 一根看跌(红色)蜡烛,开盘价高于前一收盘价,但收盘价低于前一蜡烛的中点,表明卖压。
该形态暗示市场情绪可能发生转变,买方失去控制,卖方接管。
特点与功能:
- 形态检测:
-
- 该指标基于蜡烛图价格行为扫描Dark Cloud Cover形态。
- 检测到时,会以视觉方式突出显示该形态以提醒交易者。
- 趋势过滤器(可选):
-
- 为提高准确性,指标包含一个使用移动平均线(MA)的可选趋势过滤器。
- 启用后,仅在上升趋势中出现的形态才被视为有效。
- 确认逻辑:
-
- 该指标可以通过检查下一根蜡烛验证看跌信号。
- 如果确认蜡烛收盘价低于Dark Cloud Cover的最低点且成交量高于近期蜡烛的平均成交量,则被识别为确认蜡烛。
- 这确保了信号的更强可靠性。
- 视觉标记:
-
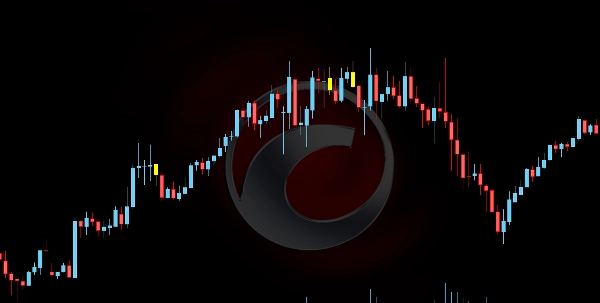
- 黄色蜡烛: 标记检测到的Dark Cloud Cover形态。
- 橙色蜡烛: 在满足成交量条件时突出显示确认蜡烛。
该指标帮助交易者发现高概率的反转设置,提升短线入场或风险管理策略的决策能力。
指标配置
0.0
评价:0
客户评价
该产品尚无评价。已经试过了?抢先告诉其他人!
Signal
cTrader Store 提供的所有产品,包括交易机器人、指标和插件,均由第三方开发者提供,仅供信息参考和技术访问之用。cTrader Store 并非经纪商,不提供投资建议、个人推荐或任何未来业绩保证。
该作者的其他作品


5
销售
429
免费安装