说明
**MA Cross Signal Advanced - 移动平均交叉指标**
一个先进且实用的指标,用于在cTrader平台上基于移动平均交叉识别买入和卖出信号。
### ✨ **主要特点:**
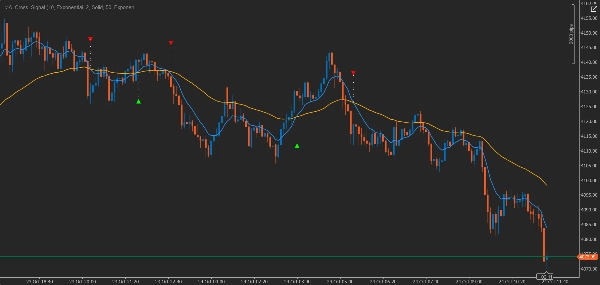
🎯 **清晰的视觉信号**
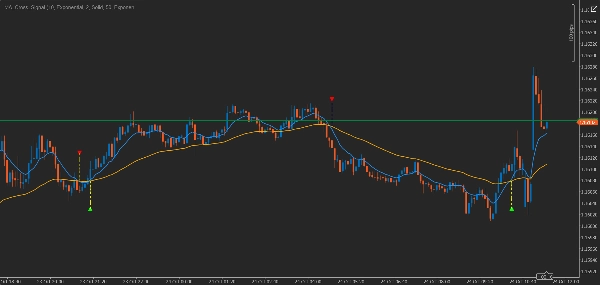
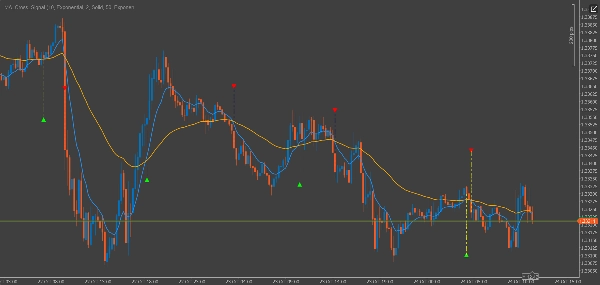
- 交叉点处的彩色箭头
- 分别显示买入(绿色)和卖出(红色)信号
- 快速识别进出场点
📊 **支持所有类型的移动平均线**
- **📈 包含cTrader中所有可用的MA类型:**
- EMA(指数移动平均线)
- SMA(简单移动平均线)
- WMA(加权移动平均线)
- HMA(Hull移动平均线)
- JMA(Jurik移动平均线)
- DEMA(双指数移动平均线)
- TEMA(三重指数移动平均线)
- TMA(三角移动平均线)
- SMMA(平滑移动平均线)
- LWMA(线性加权移动平均线)
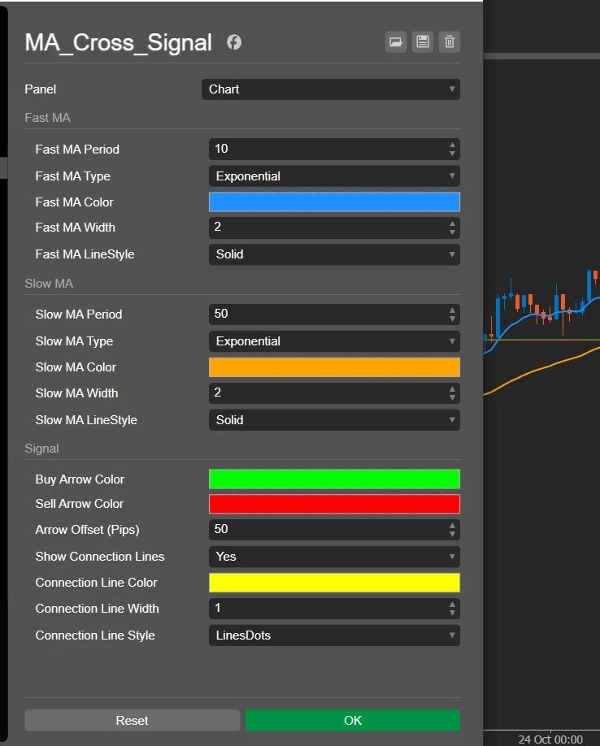
🔧 **每个MA的完整配置**
- 快速线和慢速线均可独立选择MA类型
- 每个MA可设置不同的周期
- 颜色、粗细和线型均可完全自定义
🔗 **智能连接线**
- 连接箭头与实际交叉点的视觉线条
- 颜色、粗细和线型可调节
- 有助于准确定位交叉位置
### 🛠 **应用:**
- 识别多头和空头趋势
- 确定市场进出点
- 作为其他交易策略的确认工具
- 多时间框架分析
### ⚙ **高级设置:**
- 每个MA独立配置
- 基于点差的箭头定位
- **可从cTrader中所有可用的移动平均类型中选择**
- 完全自定义颜色和样式
### 🎨 **优势:**
- 简单直观的界面
- 快速执行,无延迟
- 兼容所有货币对和时间框架
- **全面支持所有cTrader MA类型**
- 可测试不同的MA组合
该指标适用于所有交易者,从初学者到专业人士,并且支持**cTrader中所有可用的移动平均类型**,是基于移动平均交叉的技术分析的理想工具。
--------------------------------------------------------------------
MA Cross Signal Advanced - اندیکاتور شناسایی تقاطع میانگینهای متحرک
یک اندیکاتور پیشرفته و کاربردی برای شناسایی سیگنالهای خرید و فروش بر اساس تقاطع میانگینهای متحرک در پلتفرم cTrader.
✨ ویژگیهای اصلی:
🎯 سیگنالهای بصری واضح
- نمایش فلشهای رنگی در نقاط تقاطع
- سیگنالهای خرید (سبز) و فروش (قرمز) بهصورت مجزا
- امکان مشاهده سریع نقاط ورود و خروج
📊 پشتیبانی از تمامی انواع میانگینهای متحرک
- 📈 شامل تمام MAهای موجود در cTrader:
-
- EMA (میانگین متحرک نمایی)
- SMA (میانگین متحرک ساده)
- WMA (میانگین متحرک وزنی)
- HMA (میانگین متحرک هال)
- JMA (میانگین متحرک جان اید)
- DEMA (میانگین متحرک نمایی دوگانه)
- TEMA (میانگین متحرک نمایی سه گانه)
- TMA (میانگین متحرک مثلثی)
- SMMA (میانگین متحرک هموار شده)
- LWMA (میانگین متحرک وزنی خطی)
🔧 تنظیمات کامل برای هر MA
- انتخاب مستقل نوع MA برای هر دو خط سریع و کند
- تنظیم دورههای مختلف برای هر MA
- شخصیسازی کامل رنگ، ضخامت و سبک خط
🔗 خطوط اتصال هوشمند
- نمایش خطوط ارتباطی بین فلشها و نقاط تقاطع واقعی
- قابلیت تنظیم رنگ، ضخامت و سبک خطوط
- کمک به شناسایی دقیقتر نقاط کراس
🛠 کاربردها:
- شناسایی روندهای صعودی و نزولی
- تعیین نقاط ورود و خروج به بازار
- تأییدیه برای سایر استراتژیهای معاملاتی
- تحلیل چند timeframeی همزمان
⚙ تنظیمات پیشرفته:
- پیکربندی مستقل برای هر MA
- تنظیم موقعیت فلشها بر اساس پیپ
- انتخاب از بین تمامی انواع میانگین متحرک موجود
- شخصیسازی کامل رنگها و استایلها
🎨 مزایا:
- رابط کاربری ساده و قابل درک
- اجرای سریع و بدون تأخیر
- سازگار با تمام جفت ارزها و تایمفریمها
- پشتیبانی کامل از تمامی انواع MAهای cTrader
- امکان تست ترکیبات مختلف MAها
این اندیکاتور برای تمامی تریدرها از مبتدی تا حرفهای طراحی شده و با پشتیبانی از تمامی انواع میانگین متحرک موجود در cTrader، ابزار ایدهآلی برای تحلیل تکنیکال بر اساس تقاطع میانگینهای متحرک میباشد.
摘要
Users can independently configure the fast and slow moving averages, selecting different MA types, periods, colors, thicknesses, and line styles. Smart connection lines visually link arrows to exact crossover points, with adjustable color and style settings to enhance precision.
MA Cross Signal is applicable for identifying bullish and bearish trends, determining market entries and exits, confirming other trading strategies, and conducting multi-timeframe analysis. It features a simple, intuitive interface and fast execution, compatible with all currency pairs and timeframes. The indicator enables testing various MA combinations, making it suitable for traders of all experience levels seeking technical analysis based on moving average crossovers.