说明
它是什么以及它的用途
WHT AIRRA(自适应智能风险/回报算法)是一种专业指标,基于真实市场波动自动计算止损和止盈水平。这个 自适应且智能的算法 快速筛选不同的市场状态(趋势、区间、高/低波动),持续调整以适应当前条件。它消除了使用任意数字的不确定性,实现了连贯且专业的风险管理。
它不是什么
它不会生成自动买卖信号,也不是完整的交易系统。它不是预测未来走势的工具。它专注于风险管理,回答“如果错误,在哪里退出?”,而不是“在哪里进入?”。
主要特点
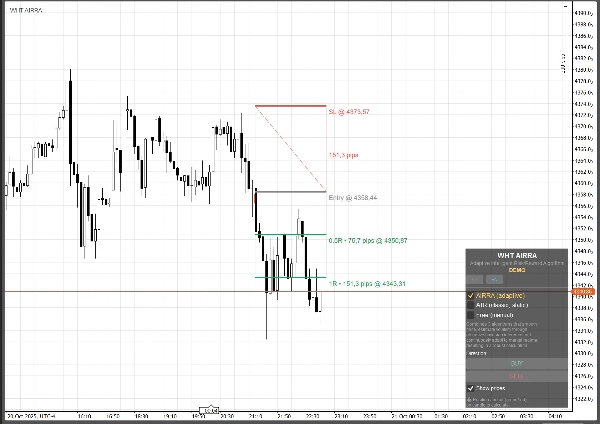
提供三种操作模式:AIRRA(带有状态识别的智能自适应)、ATR(传统经典方法)和自由(手动控制)。包含带有彩色区域、精确点差价格标签和自动风险回报比(0.5R,1.0R)的专业可视化。双语ES/EN界面,支持即时切换。 演示版限制为单实例和两个固定止盈。
技术细节
实现三层计算架构:二阶IIR递归数字滤波用于高频噪声消除,通过递归贝叶斯推断进行波动率估计并管理概率不确定性,使用带指数遗忘因子的递归最小二乘法自校准尺度因子,实现状态变化适应。自适应模式下算法复杂度为O(1),经典模式为O(N)。实时处理,逐烛更新,通过图形对象重用实现高效内存管理,连贯性验证系统,以及自动市场状态检测以动态调整内部参数。
摘要
指标配置
客户评价
0.0
评价:0
客户评价
该产品尚无评价。已经试过了?抢先告诉其他人!
讨论
常见问答
BTCUSD
Forex
Indices
EURUSD
Commodities
Prop
Scalping
Crypto
Stocks
AI
XAUUSD
NAS100
ATR
USDJPY
cTrader Store 提供的所有产品,包括交易机器人、指标和插件,均由第三方开发者提供,仅供信息参考和技术访问之用。cTrader Store 并非经纪商,不提供投资建议、个人推荐或任何未来业绩保证。
该作者的其他作品


!["Trend Angle Indicator [Iridio Capital]" 标识](https://cdn.ctrader.com/image/webp/28a98496-3412-4fea-82eb-be3347bdd6f1_27612)

价格
1.36B
交易量
78.14K
盈利点数
470
免费安装