
说明
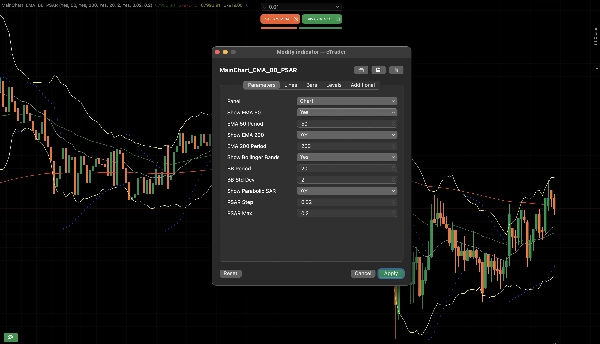
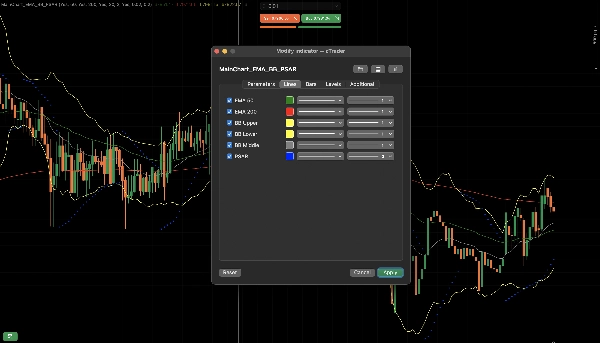
MainChart_EMA_BB_PSAR
工作原理
1. 核心概念
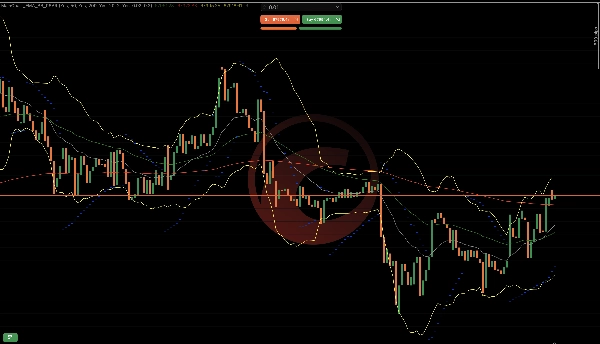
该指标将趋势、波动性和动量延续逻辑结合到一个叠加图层中:
EMA 50 & EMA 200 → 趋势方向
布林带 → 波动性与扩张
抛物线SAR → 趋势延续与反转时机
每个组件都有特定功能。它们共同构成一个结构化的决策框架。
2. EMA逻辑(趋势引擎)
功能说明
计算收盘价的指数平均值。
EMA 50反应更快。
EMA 200反应较慢。
市场解读
条件 含义
EMA 50高于EMA 200 看涨趋势
EMA 50低于EMA 200 看跌趋势
EMA 50交叉EMA 200 可能的趋势转变
为何有效
EMA平滑价格并过滤噪音。
50/200的关系显示短期动量相对于长期方向。
3. 布林带逻辑(波动性引擎)
功能说明
计算移动平均线(中轨)
利用标准差构建上下轨
市场解读
条件 含义
轨道收窄 低波动(压缩)
轨道扩张 高波动(强势运动活跃)
价格触及外轨 可能过度延伸
为何有效
市场在压缩和扩张之间循环。
突破通常发生在波动收缩之后。
4. 抛物线SAR逻辑(延续引擎)
功能说明
在价格上方或下方绘制点。
随着趋势延续加速。
市场解读
点的位置 含义
价格下方 上升趋势活跃
价格上方 下降趋势活跃
点翻转 可能反转
为何有效
PSAR随着趋势成熟而收紧,有助于追踪走势并检测疲劳。
5. 各组件如何协同工作
看涨结构
EMA 50高于EMA 200
价格高于EMA 50
PSAR位于蜡烛下方
布林带向上扩张
→ 表示强劲的上行动能
看跌结构
EMA 50低于EMA 200
价格低于EMA 50
PSAR位于蜡烛上方
布林带向下扩张
→ 表示强劲的下行动能
6. 市场阶段检测
该指标帮助识别3个市场阶段:
趋势阶段
EMA排列一致
PSAR保持一致
轨道扩张
适合延续交易。
压缩阶段
轨道收紧
EMA平坦
PSAR频繁翻转
最好等待突破。
过渡阶段
EMA交叉形成
PSAR翻转
轨道变宽
可能的早期反转。
7. 实际流程示例
看涨序列示例:
轨道收缩
强势看涨蜡烛突破上轨
EMA 50上穿EMA 200
PSAR翻转至价格下方
该序列显示:
波动性扩张
趋势确认
延续支持
8. 它不做的事情
不预测新闻
不保证反转
不测量订单流
不消除假突破
它提供结构化确认,而非确定性。
9. 总结逻辑模型
趋势过滤 → EMA
波动触发 → 布林带
时机与追踪 → 抛物线SAR
它们共同减少随机入场,提升结构化决策。
这个指标的优点是可配置,无需设置多个指标。
摘要
1. Exponential Moving Averages (EMA 50 and EMA 200) to determine trend direction—EMA 50 reacts faster to price changes, while EMA 200 provides a longer-term trend perspective. The relative position of these EMAs signals bullish or bearish trends and potential trend shifts.
2. Bollinger Bands to measure market volatility and detect phases of compression (low volatility) and expansion (high volatility). Narrow bands indicate potential breakout setups, while price touching outer bands suggests possible overextension.
3. Parabolic SAR to identify trend continuation and reversal timing by plotting dots above or below price, signaling active uptrends or downtrends and potential reversals when dots flip position.
Together, these components form a structured decision framework that helps identify market phases—trending, compression, and transition—and supports confirmation of trend strength and momentum. The indicator is configurable and designed to reduce random entries by combining trend filtering, volatility triggers, and timing signals. It is applicable across various markets including Forex, cryptocurrencies, stocks, commodities, and indices. This tool provides structured confirmation for trading decisions but does not predict news events, guarantee reversals, or eliminate false breakouts.
客户评价
5 | 50 % | |
4 | 50 % | |
3 | 0 % | |
2 | 0 % | |
1 | 0 % |


