
Mô tả
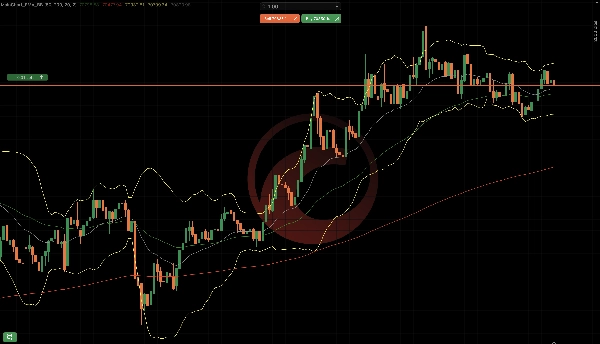
MainChart_EMA_BB là một chỉ báo phủ chính trên biểu đồ cho cTrader kết hợp:
- Đường trung bình động hàm mũ (EMA 50 & EMA 200)
- Dải Bollinger (Trên / Giữa / Dưới)
Các thành phần của chỉ báo
Đường trung bình động hàm mũ (EMA)
Có hai EMA có sẵn:
EMAKỳ mặc địnhMàu mặc định
EMA 50
50
Màu xanh lá
EMA 200
200
Màu đỏ
Mục đích:
- Hướng xu hướng
- Hỗ trợ/kháng cự động
- EMA 50 trên EMA 200 → xu hướng tăng
- EMA 50 dưới EMA 200 → xu hướng giảm
Dải Bollinger
Dải Bollinger bao gồm:
- Dải trên
- Dải giữa (dựa trên EMA)
- Dải dưới
Cài đặt mặc định:
- Kỳ: 20
- Độ lệch chuẩn: 2.0
- Loại MA: Hàm mũ
Mục đích:
- Đo lường biến động
- Vùng mua quá mức / bán quá mức
- Giá chạm dải trên → khả năng kiệt sức
- Giá chạm dải dưới → khả năng bật lại
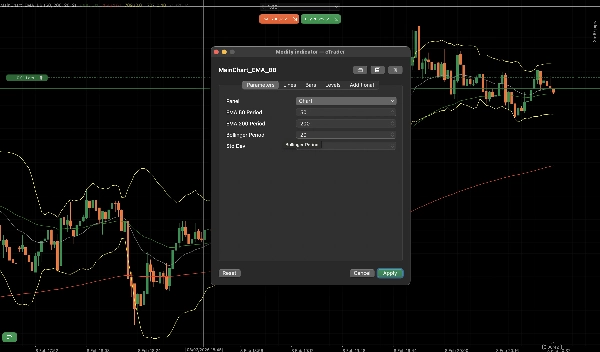
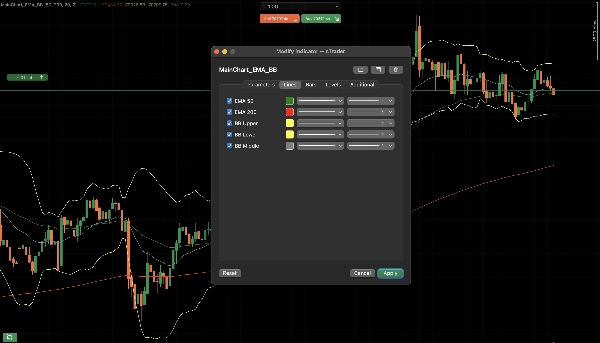
Giải thích các tham số
Tham số EMA
- Hiển thị EMA 50: Bật/tắt EMA 50
- Kỳ EMA 50: Kỳ tính toán
- Hiển thị EMA 200: Bật/tắt EMA 200
- Kỳ EMA 200: Kỳ tính toán
Tham số Dải Bollinger
- Hiển thị Dải Bollinger: Bật/tắt BB
- Kỳ BB: Kỳ nhìn lại
- Độ lệch chuẩn BB: Hệ số biến động
Sử dụng giao dịch điển hình
Xác nhận xu hướng
- EMA 50 trên EMA 200
- Ưu tiên giao dịch mua dài hạn
Đảo chiều / Điều chỉnh
- Giá điều chỉnh về EMA 50
- Dải Bollinger co lại rồi mở rộng
Điều tốt về chỉ báo này là có thể cấu hình và không cần thiết lập nhiều chỉ báo.
Tóm tắt
Hồ sơ chỉ báo
Đánh giá của khách hàng
4.5
Đánh giá: 2
5 | 50 % | |
4 | 50 % | |
3 | 0 % | |
2 | 0 % | |
1 | 0 % |
Đánh giá của khách hàng
February 16, 2026
a 1R exit plan makes review easier, and messy areas become easier to avoid.
February 15, 2026
Thảo luận
Câu hỏi thường gặp
Prop
Forex
Indices
Commodities
Crypto
Stocks
Bollinger
Các sản phẩm có sẵn trên cTrader Store, bao gồm bot giao dịch, chỉ báo và plugin, được cung cấp bởi các nhà phát triển bên thứ ba và chỉ nhằm mục đích cung cấp thông tin và tiếp cận kỹ thuật. cTrader Store không phải là nhà môi giới và không cung cấp lời khuyên đầu tư, khuyến nghị cá nhân hay bất kỳ đảm bảo nào về hiệu suất trong tương lai.
Sản phẩm khác của tác giả này


Giá
Kể từ 01/04/2025