
WAVETREND_withSourceCode
Chỉ báo
Phiên bản 1.0, Oct 2025
Windows, Mac
5.0
Đánh giá: 2
Mô tả
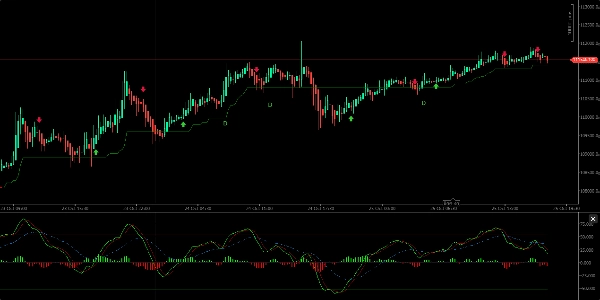
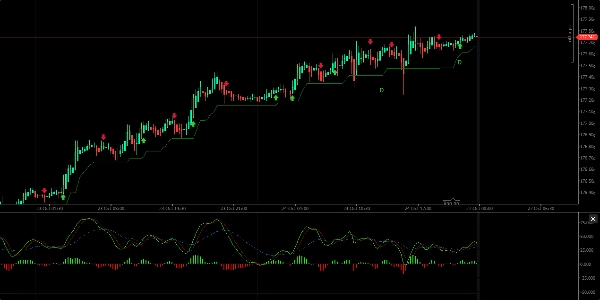
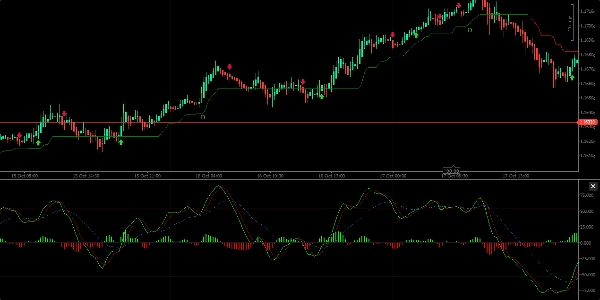
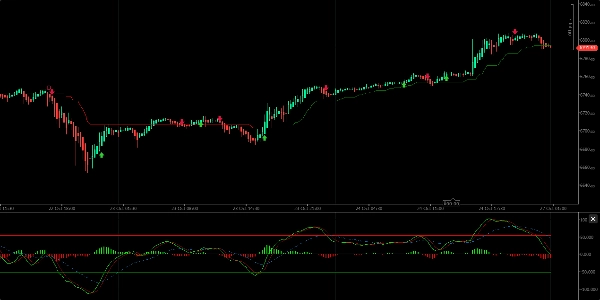
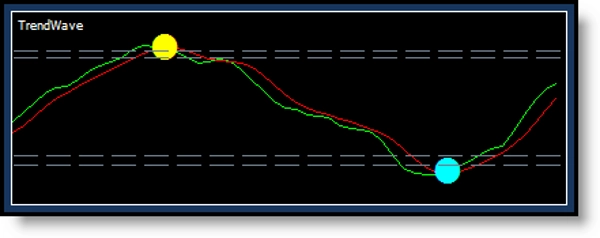
Nó cung cấp các tín hiệu mua-bán, chỉ báo hướng xu hướng và xác định các vùng mua quá mức và bán quá mức. Về mặt trực quan, nó bao gồm hai đường giá trị với một đám mây/biểu đồ thanh ở giữa, di chuyển lên trên và xuống dưới một đường giữa, đại diện cho xu hướng tăng hoặc giảm.
Các tính năng chính:
- Tín hiệu mua xuất hiện khi đường xanh lá cây cắt lên trên đường đỏ; tín hiệu bán khi đường xanh lá cây cắt xuống dưới.
- Nó hiển thị hướng xu hướng với các sóng đám mây ở trên hoặc dưới đường giữa.
- Chỉ báo hiển thị các chấm xanh (mua) và đỏ (bán) tại các điểm giao cắt, kèm theo thay đổi màu nến tương ứng (vàng cho mua, ngọc lam cho bán).
- Tốt nhất nên sử dụng trên các khoảng thời gian 12 giờ hoặc 1 ngày để tránh nhiễu ngắn hạn quá mức.
- Chỉ báo có thể xác định sự phân kỳ giữa giá và động lượng (phân kỳ tăng và giảm thông thường), báo hiệu khả năng đảo chiều giá.
- Khuyến nghị kết hợp WaveTrend với các chỉ báo khác như WMA, CMF, RSI và MACD để có quyết định giao dịch đáng tin cậy hơn.
Tổng thể, WaveTrend là một công cụ chức năng hữu ích để xác định hướng xu hướng và tín hiệu giao dịch nhưng nên được sử dụng cùng với các công cụ phân tích khác để xác nhận.
Tóm tắt
Hồ sơ chỉ báo
Đánh giá của khách hàng
5.0
Đánh giá: 2
5 | 100 % | |
4 | 0 % | |
3 | 0 % | |
2 | 0 % | |
1 | 0 % |
Đánh giá của khách hàng
November 6, 2025
the main upside is the trade idea gets slowed down first. The setup still needs say no.
Thảo luận
Câu hỏi thường gặp
Signal
ZigZag
EURUSD
Supertrend
GBPUSD
RSI
XAUUSD
NAS100
ATR
MACD
Các sản phẩm có sẵn trên cTrader Store, bao gồm bot giao dịch, chỉ báo và plugin, được cung cấp bởi các nhà phát triển bên thứ ba và chỉ nhằm mục đích cung cấp thông tin và tiếp cận kỹ thuật. cTrader Store không phải là nhà môi giới và không cung cấp lời khuyên đầu tư, khuyến nghị cá nhân hay bất kỳ đảm bảo nào về hiệu suất trong tương lai.


Giá
Kể từ 16/03/2025
256
Cài đặt miễn phí