Mô tả
Bounty Killa – chỉ báo săn lùng thanh khoản dừng lỗ trước khi các nhà đầu tư lớn làm điều đó.
Bounty Killa là một chỉ báo cTrader được thiết kế cho các nhà giao dịch yêu thích giao dịch săn dừng / bắt thanh khoản: những cây nến tăng vọt trên đỉnh cao hoặc dưới đáy thấp, xóa các điểm dừng rồi đảo chiều theo hướng ngược lại.
Chỉ báo tự động quét từng cây nến và đánh dấu:
- SHS (Stop Hunt High) – khả năng săn dừng trên các đỉnh gần đây → khu vực để tìm thiết lập lệnh bán
- SHL (Stop Hunt Low) – khả năng săn dừng dưới các đáy gần đây → khu vực để tìm thiết lập lệnh mua
Logic phát hiện được xây dựng dựa trên:
- phá vỡ các đỉnh/đáy gần đây ít nhất X pips,
- một đuôi nến dài kéo dài vượt mức đó,
- một thân nến nhỏ và đóng cửa theo hướng ngược lại của cú phá vỡ.
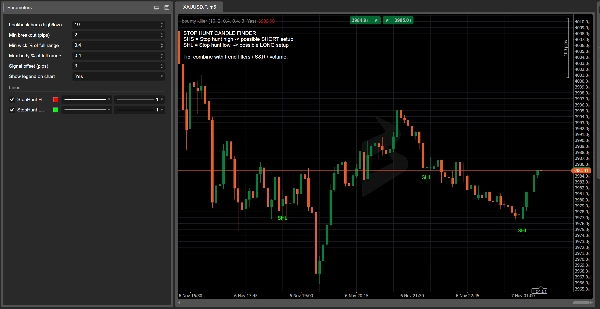
Không còn phải đoán “có thể đây là một cú săn dừng”: Bounty Killer làm nổi bật các cây nến quan trọng trực tiếp trên biểu đồ của bạn, với nhãn, màu sắc rõ ràng và chú giải trên biểu đồ.
Tại sao các nhà giao dịch thích nó:
- Hiển thị nơi thị trường có thể đã bắt thanh khoản và nơi một sự đảo chiều trở nên có ý nghĩa hơn.
- Hoàn toàn tùy chỉnh được: cửa sổ nhìn lại, mức phá vỡ tối thiểu tính bằng pips, tỷ lệ thân/đuôi nến, độ lệch tín hiệu.
- Kết hợp hoàn hảo với các khái niệm cổ điển về hỗ trợ/kháng cự, cung & cầu, khối lượng, khối lệnh và các khái niệm SMC.
- Tuyệt vời cho các nhà giao dịch theo dõi thiết lập dựa trên thanh khoản nhưng muốn một thứ gì đó khách quan và dựa trên quy tắc thay vì chỉ dựa vào cảm quan.
⚠️ Bounty Killa không phải là một hệ thống giao dịch đầy đủ và không mở hoặc đóng các giao dịch.
Các cây nến được đánh dấu là các vùng thông tin cao nên được tích hợp với chiến lược, phân tích xu hướng và quản lý rủi ro của riêng bạn.
Bounty Killa – Hướng dẫn sử dụng nhanh (EN)
1. Thị trường & khung thời gian được khuyến nghị
- Khung thời gian: H1, H4, D1
(Khung thời gian thấp hơn như M1–M5 = nhiều nhiễu, chủ yếu dùng để nghiên cứu.) - Ký hiệu: chỉ số, FX, tiền điện tử, cổ phiếu, hàng hóa – bất cứ nơi nào bạn có thể gắn chỉ báo cTrader.
2. Cách đọc tín hiệu
- SHS – Stop Hunt High (nhãn đỏ trên nến)
-
- Giá tăng vọt trên các đỉnh gần đây, tạo ra một đuôi trên dài, và đóng cửa giảm.
- Ý tưởng: khả năng thiết lập lệnh bán sau một cú phá vỡ giả và bắt thanh khoản trên đỉnh.
- SHL – Stop Hunt Low (nhãn xanh dưới nến)
-
- Giá tăng vọt dưới các đáy gần đây, tạo ra một đuôi dưới dài, và đóng cửa tăng.
- Ý tưởng: khả năng thiết lập lệnh mua sau một cú phá vỡ giả và bắt thanh khoản dưới đáy.
Bounty Killer không nói “mua/bán ngay bây giờ”.
Nó làm nổi bật vùng thanh khoản nơi một sự đảo chiều có ý nghĩa hơn.
3. Cài đặt cơ bản đề xuất
Trong các tham số chỉ báo:
- Số thanh nhìn lại (cao/thấp):
10–20
→ số thanh cần nhìn lại để tìm đỉnh/đáy gần đây. - Phá vỡ tối thiểu (pips):
5–15pips
→ khoảng cách tối thiểu vượt qua đỉnh/đáy để tính là một cú săn dừng. - Tỷ lệ đuôi tối thiểu của toàn bộ phạm vi:
0.60–0.70
→ ít nhất 60–70% của cây nến phải là đuôi theo hướng săn dừng. - Tỷ lệ thân tối đa của toàn bộ phạm vi:
0.25–0.35
→ thân nhỏ so với tổng phạm vi cây nến. - Độ lệch tín hiệu (pips):
3–5
→ chỉ mang tính trực quan, di chuyển nhãn SHS/SHL hơi xa cây nến.
4. Ví dụ chiến lược đơn giản
Bộ lọc xu hướng (EMA 200):
- Thêm một EMA 200 vào biểu đồ của bạn.
- Chỉ lệnh bán:
-
- Giá dưới EMA 200
- Bạn nhận được tín hiệu SHS (săn dừng trên).
- Chỉ lệnh mua:
-
- Giá trên EMA 200
- Bạn nhận được tín hiệu SHL (săn dừng dưới).
Ý tưởng vào lệnh:
- Chờ cây nến săn dừng đóng cửa.
- Vào lệnh ở cây nến tiếp theo chỉ khi giá xác nhận:
-
- Đối với SHS: cây nến tiếp theo phá vỡ đáy của cây nến SHS → xem xét lệnh bán.
- Đối với SHL: cây nến tiếp theo phá vỡ đỉnh của cây nến SHL → xem xét lệnh mua.
Dừng lỗ:
- Đối với SHS (bán) → SL ngay phía trên đỉnh của cây nến SHS.
- Đối với SHL (mua) → SL ngay phía dưới đáy của cây nến SHL.
Chốt lời:
- Mục tiêu ít nhất 1:1.5 hoặc 1:2 R/R, hoặc
- Sử dụng các đỉnh/đáy swing gần đó, hỗ trợ/kháng cự hoặc vùng cung/cầu làm mục tiêu.
5. Ghi chú an toàn & danh sách kiểm tra nhanh
Trước khi sử dụng tín hiệu Bounty Killer, hãy hỏi:
- Xu hướng?
Tín hiệu có phù hợp với xu hướng tổng thể (EMA 200 / cấu trúc thị trường) không? - Mức độ?
Cú săn dừng có xảy ra tại một mức có ý nghĩa (đỉnh/đáy trước đó, hỗ trợ/kháng cự, đỉnh/đáy phiên, v.v.) không? - Bối cảnh?
Có tin tức, phiên mở/đóng, đột biến biến động không? - Rủi ro?
Kích thước dừng lỗ của bạn có phù hợp với quản lý vốn (tỷ lệ phần trăm tối đa mỗi giao dịch) không?
Nếu 3–4 điểm này trùng khớp, SHS/SHL từ Bounty Killa không chỉ là “một cây nến đẹp”, mà là một vùng giá trị cao để xây dựng ý tưởng giao dịch xung quanh.
Tóm tắt
The detection criteria include a breakout beyond recent highs/lows by a configurable number of pips, a long wick extending beyond that level, a small candle body, and a close opposite to the breakout direction. Signals are displayed directly on the chart with clear labels and colors, supported by an on-chart legend.
Recommended for use on hourly to daily timeframes (H1, H4, D1) across various markets including forex, indices, cryptocurrencies, stocks, and commodities, Bounty Killa is fully customizable with parameters such as lookback period, minimum breakout size, wick and body proportions, and signal label offset.
The indicator highlights high-value liquidity zones to support trading decisions but does not execute trades. It is intended to be combined with other analysis tools like support/resistance, volume, order blocks, and trend filters (e.g., 200 EMA) for developing objective, rule-based liquidity-based trading setups.
Đánh giá của khách hàng
5 | 50 % | |
4 | 50 % | |
3 | 0 % | |
2 | 0 % | |
1 | 0 % |


![Logo "[Stellar Strategies] MARSI Signal Plotter"](https://cdn.ctrader.com/image/webp/7b2b8da6-8f8e-4646-8d4a-4710c516c01e_25567)

