

Mô tả
NGÀY DÙNG THỬ SUPER TREND OSCILLATOR 15
"CHÚ Ý," TRONG CÁC PHIÊN BẢN TRẢ PHÍ CŨNG CÓ PHIÊN BẢN DÙNG THỬ MIỄN PHÍ 15 NGÀY" nhấp vào sản phẩm trả phí và bạn sẽ tìm thấy phiên bản miễn phí-
Bộ dao động SuperTrend Đơn giản hóa - Mô tả đầy đủ
Tổng quan
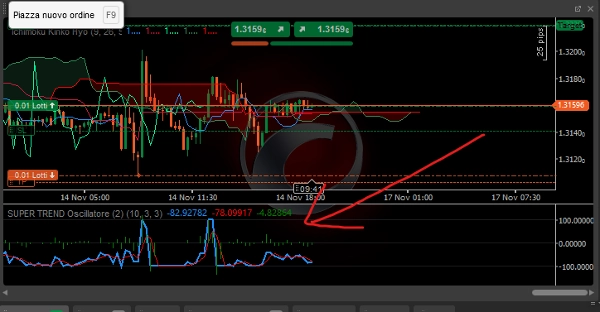
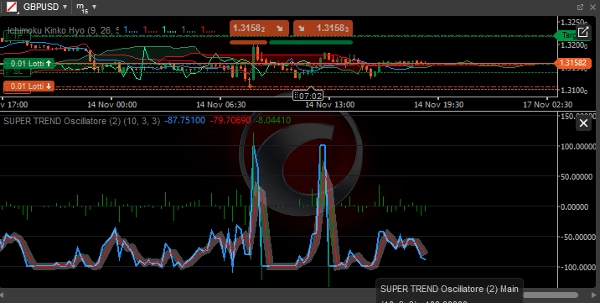
Bộ dao động SuperTrend Đơn giản hóa là một chỉ báo kỹ thuật nâng cao cho cTrader biến SuperTrend cổ điển thành một bộ dao động trực quan, giúp dễ dàng xác định hướng đi của xu hướng, sức mạnh và độ tin cậy.
Các thành phần chính
1. Đường chính (Xanh dương)
- Chức năng: Hiển thị khoảng cách chuẩn hóa giữa giá và đường SuperTrend
- Cách tính:
((Price - SuperTrend) / (ATR × Multiplier)) × 100 - Diễn giải:
-
- > 0: Xu hướng tăng (giá trên SuperTrend)
- < 0: Xu hướng giảm (giá dưới SuperTrend)
- Phạm vi: Từ -100 đến +100
2. Đường tín hiệu (Đỏ)
- Chức năng: Trung bình động đơn giản của đường chính
- Chu kỳ: Có thể tùy chỉnh (mặc định 3 chu kỳ)
- Cách sử dụng: Lọc nhiễu thị trường và xác nhận tín hiệu
3. Biểu đồ cột (Xám)
- Chức năng: Hiệu số giữa đường chính và đường tín hiệu
- Diễn giải:
-
- Dương: Đà tăng đang gia tốc
- Âm: Đà giảm đang gia tốc
- Giao cắt 0: Tiềm năng đảo chiều đà
Các tham số có thể cấu hình
Tham số SuperTrend:
- Chu kỳ ATR: Chu kỳ tính Trung bình Khoảng dao động Thực (mặc định: 10)
- Hệ số nhân: Hệ số nhân cho dải SuperTrend (mặc định: 3.0)
Tham số Bộ dao động:
- Chu kỳ tín hiệu: Chu kỳ cho đường tín hiệu (mặc định: 3)
Diễn giải tín hiệu
Điều kiện xu hướng:
- Xu hướng tăng mạnh:
-
- Đường chính > +50
- Đường chính > Đường tín hiệu
- Biểu đồ cột dương
- Xu hướng giảm mạnh:
-
- Đường chính < -50
- Đường chính < Đường tín hiệu
- Biểu đồ cột âm
- Thị trường đi ngang:
-
- Đường chính trong khoảng -30 đến +30
- Các điểm giao cắt đường thường xuyên
Tín hiệu giao dịch:
Vào lệnh mua:
- Đường chính cắt lên trên 0
- Biểu đồ cột chuyển sang dương
- Đường tín hiệu xác nhận xu hướng tăng
- Đường chính trên +20 để có đà
Vào lệnh bán:
- Đường chính cắt xuống dưới 0
- Biểu đồ cột chuyển sang âm
- Đường tín hiệu xác nhận xu hướng giảm
- Đường chính dưới -20 để có đà
Thoát lệnh / Chốt lời:
- Mua: Đường chính > +80 (quá mua) hoặc cắt xuống dưới Đường tín hiệu
- Bán: Đường chính < -80 (quá bán) hoặc cắt lên trên Đường tín hiệu
Ưu điểm của phiên bản đơn giản hóa
1. Hiệu suất tối ưu
- Tính toán hiệu quả hơn
- Tiêu thụ tài nguyên thấp hơn
- Phản ứng nhanh hơn với biến động giá
2. Dễ sử dụng
- Giảm số lượng tham số cần thiết
- Tín hiệu trực quan ngay lập tức
- Dễ dàng diễn giải ngay cả với nhà giao dịch mới
3. Độ tin cậy
- Ít bị ảnh hưởng bởi nhiễu
- Tín hiệu rõ ràng và xác định hơn
- Giảm tín hiệu sai so với SuperTrend cổ điển
Chiến lược sử dụng
Chiến lược theo xu hướng:
- Vào lệnh: Đường chính > 0 cho lệnh mua, Đường chính < 0 cho lệnh bán
- Bộ lọc: Biểu đồ cột cùng dấu với Đường chính
- Thoát lệnh: Đảo dấu hoặc đạt mức cực trị
Chiến lược động lượng:
- Vào lệnh: Đường chính > +30 (mua) hoặc Đường chính < -30 (bán)
- Xác nhận: Biểu đồ cột đang gia tốc
- Thoát lệnh: Đà giảm tốc (biểu đồ cột giảm)
Chiến lược hồi quy trung bình:
- Vào lệnh: Đường chính > +80 (bán) hoặc Đường chính < -80 (mua)
- Xác nhận: Biểu đồ cột đảo chiều
- Thoát lệnh: Trở về vùng trung tính
Điều kiện thị trường tối ưu
Thị trường có xu hướng:
- Hiệu quả cao
- Tín hiệu kéo dài
- Ít bị nhiễu đảo chiều
Thị trường đi ngang:
- Giảm kích thước lệnh
- Kéo dài khung thời gian
- Sử dụng làm bộ lọc động lượng
Thực hành tốt nhất
Khung thời gian được khuyến nghị:
- Trong ngày: M15 - H1
- Giao dịch Swing: H4 - D1
- Giao dịch vị thế: W1 - MN
Quản lý rủi ro:
- Dừng lỗ: 1.5-2 × ATR
- Chốt lời: 2-3 × Rủi ro
- Kích thước vị thế: 1-2% mỗi giao dịch
Xác nhận bổ sung:
- Sự đồng bộ nhiều khung thời gian
- Xác nhận khối lượng
- Các mức hỗ trợ/kháng cự chính
Hạn chế
Cân nhắc:
- Độ trễ vốn có (chỉ báo theo xu hướng)
- Hiệu suất giảm trong thị trường đi ngang
- Cần xác nhận trong điều kiện biến động thấp
Khuyến nghị:
- Kết hợp với phân tích hành động giá
- Sử dụng làm bộ lọc, không phải hệ thống độc lập
- Thử nghiệm bản demo trước khi sử dụng thực tế
Bộ dao động này đại diện cho một công cụ mạnh mẽ để xác định các xu hướng mạnh và lọc các tín hiệu sai trong khi vẫn giữ được sự đơn giản trong vận hành phù hợp cho cả nhà giao dịch mới và có kinh nghiệm.
Tóm tắt
Đánh giá của khách hàng
5 | 0 % | |
4 | 100 % | |
3 | 0 % | |
2 | 0 % | |
1 | 0 % |


![Logo "[Stellar Strategies] Smart ADX"](https://cdn.ctrader.com/image/webp/af13b084-b6f6-41db-b7bc-c7e688b57b05_36929)

