

Описание
🚀 Risk Appetite & Directional Bias ULTRA (cTrader) — профессиональный индикатор рыночного режима, предназначенный для измерения Risk-On / Neutral / Risk-Off условий и преобразования их в чёткий, практический направленный уклон. Вместо опоры на один рынок он сравнивает два инструмента («риск-прокси» и «эталон») для построения в реальном времени Risk Score (0–100), выделения переходов режимов и суммирования всего через отображение панели управления на графике.
🔧 Что означают первые два параметра (и почему они важны)
🟠 Символ риск-актива (BTC)
Это риск-прокси — инструмент, используемый как «термометр аппетита к риску». Он обозначен как «BTC», потому что изначальная концепция использует Биткойн в качестве глобального прокси для риск-он, но вы не обязаны использовать именно Биткойн. Вы можете установить любой актив, который хорошо отражает настроение риска (например, BTC, NASDAQ/US100, индексы с высоким бета-коэффициентом и т.д.).
🔵 Символ эталона (SP/US500)
Это референтный рынок (эталон), который вы хотите отслеживать для макроуклона. Обычно это US500/SPX500, но это может быть любой инструмент, который вы считаете своим основным «драйвером контекста».
✅ Кратко:
- Риск-актив = сенсор настроения (источник аппетита к риску)
- Эталон = референтный рынок, который должен отражать уклон
❓ Нужно ли использовать именно Биткойн?
Нет. Вы можете использовать индикатор по-разному в зависимости от вашей цели:
✅ A) Макро «классический» Risk-On/Risk-Off (рекомендуется)
- Риск-актив: BTCUSD
- Эталон: US500 / SPX500
Это даёт чёткое представление о глобальных режимах риска.
✅ B) Торговля Биткойном с макроконтекстом
- Риск-актив: BTCUSD
- Эталон: US500 (или другой макро-референс)
Это помогает понять, когда макроусловия поддерживают или противостоят BTC.
✅ C) Мультиактивные / пользовательские рыночные отношения
- Риск-актив: BTC или US100
- Эталон: рынок, который вы хотите фильтровать (GER40, XAUUSD и т.д.)
Это превращает индикатор в гибкий «двигатель настроений».
⚙️ Как это работает (основная логика)
Модель вычисляет следующее для обоих символов:
📈 Доходность (%) (опционально логарифмическая для большей стабильности)
📊 Волатильность (стандартное отклонение за выбранный период)
🔗 Скользящая корреляция между двумя рядами доходности
🎛️ Динамический вес, который регулирует влияние риск-прокси на основе:
- силы корреляции
- относительной волатильности
Это создаёт сигнал Скорректированное изменение, который:
- сглажен EMA
- нормализован в Risk Score от 0 до 100
📊 Как читать (самые важные сигналы)
🎯 Risk Score (0–100) — ваш главный компас:
🟢 Risk-On (оценка выше верхнего порога, например, > 60)
→ аппетит к риску сильный, среда часто благоприятствует моментуму/рисковым активам
🔵 Нейтрально (между нижним и верхним порогами, например, 40–60)
→ переход / флет / смешанные сигналы, рекомендуется фильтрация
🔴 Risk-Off (оценка ниже нижнего порога, например, < 40)
→ защитная среда, осторожность выше, риск снижения часто повышен
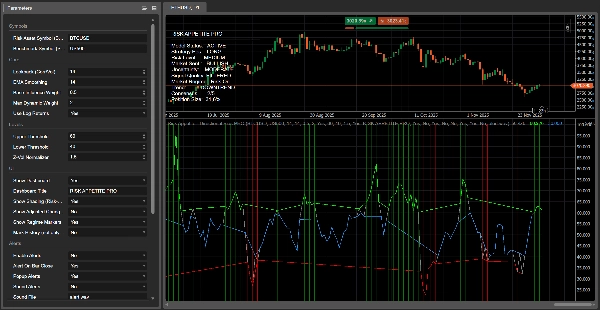
🔴 Почему красная линия «прерывается» (и что это значит)
В этой версии ULTRA визуализация сделана намеренно и основана на режимах:
- Непрерывная базовая линия (серая) всегда видна
- Цветные наложения появляются только в своём режиме:
-
- Красное наложение только во время Risk-Off
- Зелёное наложение только во время Risk-On
- Синее наложение во время Neutral
Таким образом, когда рынок покидает Risk-Off и переходит в Neutral (или Risk-On), красное наложение становится пустым (NaN) и cTrader перестаёт его рисовать — поэтому кажется, что оно «прерывается». ✅
📌 Важно: это не означает автоматически, что медвежий тренд «завершён».
Это значит, что модель больше не обнаруживает сильные, подтверждённые условия Risk-Off, поэтому медвежий уклон снижен, и рынок, вероятно, находится в переходе.
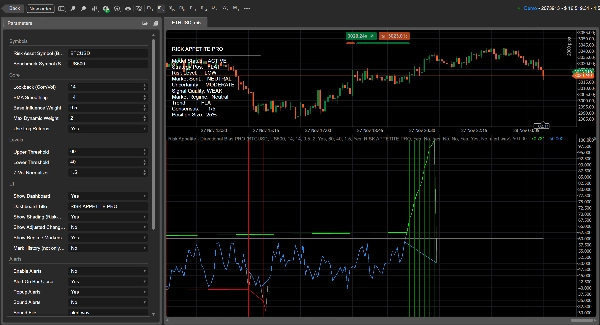
🖥️ Для чего служит отображение на графике (панель управления) — объяснение по строкам
Панель управления — это ваша панель принятия решений в реальном времени. Она суммирует режим, уверенность и тактические рекомендации, чтобы вам не пришлось догадываться, глядя только на линию.
✅ Статус модели
Показывает, работает ли модель корректно.
- ACTIVE = доступны корректные данные и расчёты верны
- NO DATA = отсутствуют данные по символу, неверное имя символа или недостаточно истории/синхронизации по времени
🎯 Strategy Pos (позиция стратегии)
Рекомендуемая позиция на основе режима:
- LONG = Risk-On
- SHORT = Risk-Off
- FLAT = Neutral
⚠️ Уровень риска
Мера интенсивности риска на основе волатильности рынка и неопределённости.
- ОЧЕНЬ НИЗКИЙ / НИЗКИЙ = более стабильные условия
- СРЕДНИЙ = нормальный
- ВЫСОКИЙ / ОЧЕНЬ ВЫСОКИЙ = больше шума, выше риск ложных сигналов; уменьшайте размер или требуйте более сильного подтверждения
🧠 Настроение рынка
Направленный тон, выведенный из уровня оценки:
- БЫЧИЙ / МЕДВЕЖИЙ / НЕЙТРАЛЬНЫЙ
🌫️ Неопределённость
Показывает, насколько «ясна» модель. Увеличивается, когда:
- корреляция ослабевает, или
- волатильность растёт (более нестабильная среда)
Уровни: НИЗКИЙ / СРЕДНИЙ / ВЫСОКИЙ
🧪 Качество сигнала
Комбинированная оценка на основе:
- силы сигнала (расстояние от 50)
- уровня неопределённости
Выходы: СИЛЬНЫЙ / ОТФИЛЬТРОВАННЫЙ / СЛАБЫЙ
🔥 Рыночный режим
Основная классификация:
- Risk-On / Neutral / Risk-Off
Это основной режим, управляющий цветными наложениями, затенением и уклоном позиции.
📉 Тренд
Краткосрочное направление оценки (наклон):
- ВВЕРХ = растущий аппетит к риску
- ВНИЗ = падающий аппетит к риску
- ФЛЕТ = боковое движение / низкий моментум
🗳️ Консенсус (X/5)
Простая оценка согласованности, которая считает, сколько ключевых условий совпадают (направление, наклон, согласование корреляции и т.д.).
Чем выше — тем чище и последовательнее среда.
📏 Размер позиции
Рекомендуемый процент экспозиции на основе силы сигнала и неопределённости:
- сильный сигнал и низкая неопределённость → рекомендация увеличить размер
- слабый или неопределённый сигнал → рекомендация уменьшить размер
🧭 Преимущество мультивременных интервалов (очень мощно на практике)
Когда вы анализируете один и тот же рынок на нескольких таймфреймах, индикатор обновляется и выравнивается по каждому таймфрейму. Это облегчает выявление:
✅ Выравнивания таймфреймов (более сильные сигналы)
✅ Конфликта таймфреймов (часто более нейтральные/флетовые условия)
Более высокие таймфреймы определяют макрорежим, более низкие помогают с таймингом входов внутри этого режима.
📌 Маркеры, оповещения и уведомления (функции ULTRA)
✨ Маркеры режима отображаются на графике при смене режима:
- Risk-On ↔ Neutral ↔ Risk-Off
Это делает переходы мгновенно видимыми.
🔔 Оповещения и уведомления могут быть включены, чтобы вы получали:
- всплывающие оповещения (и опциональный звук)
- оповещения при закрытии бара (рекомендуется, чтобы избежать ложных срабатываний во время формирования свечи)
💬 Присоединяйтесь к нашему сообществу (оптимизации + пресеты + инструменты)
Хотите получить максимальную производительность от этого индикатора? Присоединяйтесь к нашему Discord для:
✅ оптимизации параметров для символов вашего брокера
✅ готовых пресетов (Крипто / Индексы / FX)
✅ руководства по настройке мультивременных интервалов
✅ продвинутых инструментов и обновлений, улучшающих фильтрацию сигналов и качество исполнения
Сводка
Отзывы покупателей
5 | 100 % | |
4 | 0 % | |
3 | 0 % | |
2 | 0 % | |
1 | 0 % |


