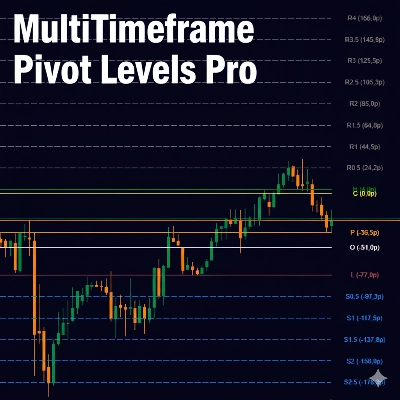
MultiTimeframe Pivot Levels Pro
Chỉ báo
Phiên bản 1.0, Nov 2025
Windows, Mac
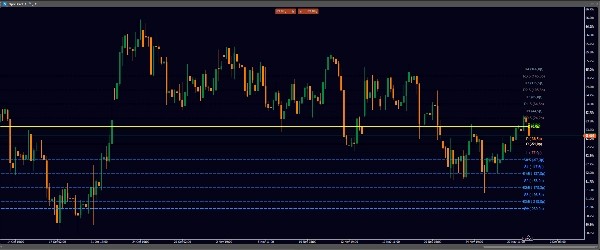
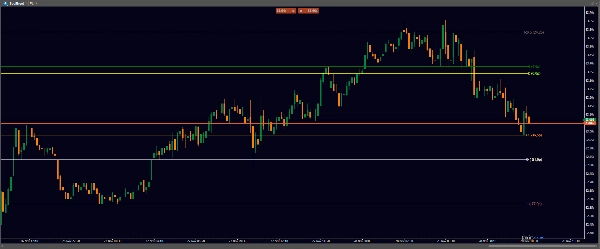
MultiTimeframe Pivot Levels Pro là một chỉ báo giao dịch nâng cao hiển thị các điểm pivot và các mức hỗ trợ/kháng cự từ các khung thời gian cao hơn trực tiếp trên biểu đồ hiện tại của bạn. Công cụ mạnh mẽ này giúp các nhà giao dịch xác định các mức giá chính để vào và thoát lệnh một cách chiến lược.
Các tính năng chính:
- Phân tích đa khung thời gian (hiển thị các điểm pivot hàng Ngày, Tuần, Tháng trên bất kỳ biểu đồ nào)
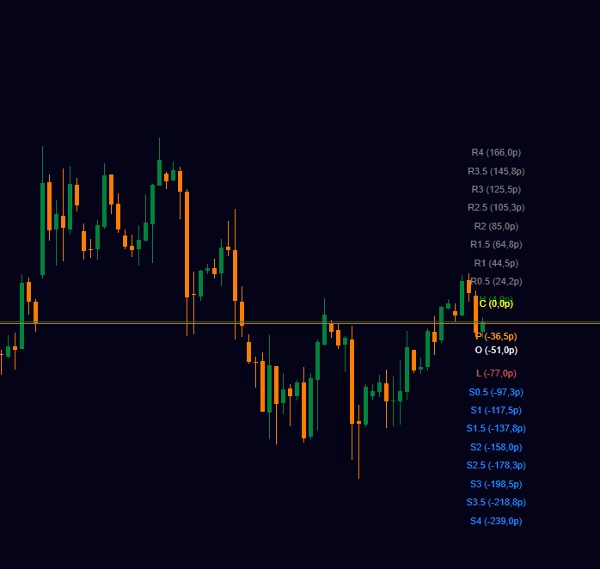
- 8 mức hỗ trợ và 8 mức kháng cự cho cấu trúc thị trường toàn diện
- Hai phương pháp tính pivot (Cổ điển: H+L/2, Tiêu chuẩn: H+L+C/3)
- Màu sắc và độ hiển thị có thể tùy chỉnh cho tất cả các mức
- Hiển thị khoảng cách tính bằng pip từ giá hiện tại
- Hiệu suất tối ưu cho hoạt động mượt mà
- Trình bày trực quan sạch sẽ, chuyên nghiệp
Phù hợp cho:
- Các nhà giao dịch Swing sử dụng nhiều khung thời gian
- Các nhà giao dịch trong ngày cần các mức tham chiếu chính
- Các nhà giao dịch hành động giá xác định hỗ trợ/kháng cự
- Tất cả các phong cách giao dịch tìm kiếm giao dịch dựa trên mức chính xác
Hồ sơ chỉ báo
0.0
Đánh giá: 0
Đánh giá của khách hàng
Sản phẩm này chưa có đánh giá nào. Bạn đã dùng thử chưa? Hãy là người đầu tiên chia sẻ với mọi người!
BTCUSD
Forex
Indices
EURUSD
Commodities
GBPUSD
NZDUSD
Crypto
Stocks
XAUUSD
NAS100
USDJPY
Các sản phẩm có sẵn trên cTrader Store, bao gồm bot giao dịch, chỉ báo và plugin, được cung cấp bởi các nhà phát triển bên thứ ba và chỉ nhằm mục đích cung cấp thông tin và tiếp cận kỹ thuật. cTrader Store không phải là nhà môi giới và không cung cấp lời khuyên đầu tư, khuyến nghị cá nhân hay bất kỳ đảm bảo nào về hiệu suất trong tương lai.
Sản phẩm khác của tác giả này


Kể từ 28/12/2024
54
Cài đặt miễn phí