

Descripción
# VMM TRADE VISION LITE - Herramienta gratuita de gestión de posiciones
## 📌 CLASIFICACIÓN: SOLO ANALÍTICO / INFORMATIVO
**ESTE INDICADOR ES PURAMENTE ANALÍTICO E INFORMATIVO**
- ❌ No ejecuta órdenes
- ❌ No modifica posiciones
- ❌ No gestiona el riesgo automáticamente
- ❌ No proporciona señales de trading
- ✅ Proporciona análisis de posiciones en tiempo real para la toma de decisiones manual
---
## 🎯 Resumen
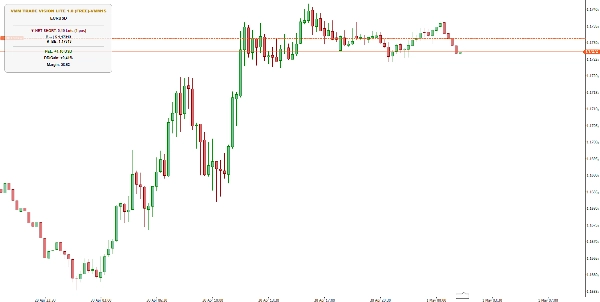
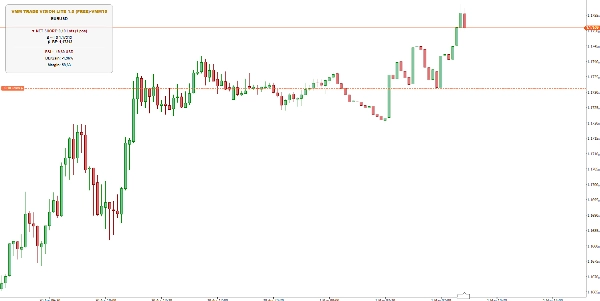
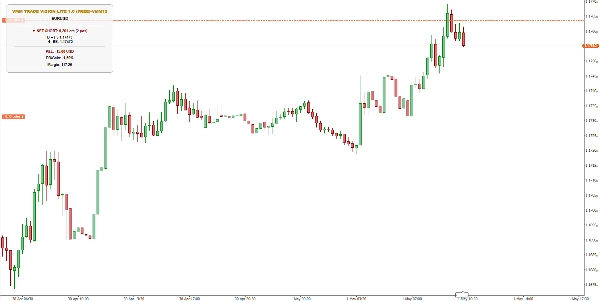
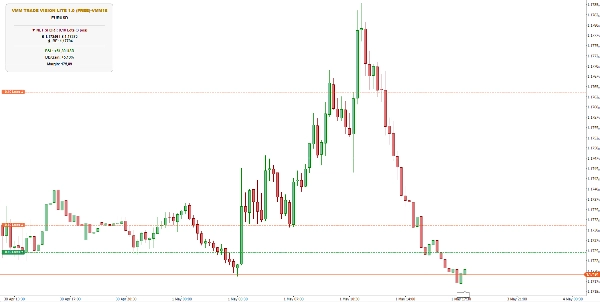
Indicador de seguimiento de posiciones de grado profesional **analítico** para cTrader. Supervisa toda tu actividad de trading de un vistazo con métricas en tiempo real que incluyen posición NETA, punto de equilibrio global, precios promedio de entrada, uso de margen y porcentaje de drawdown.
**100% ANALÍTICO - Cero trading automatizado**
---
## ✨ Características clave (Solo analítico/visualización)
### 📊 Análisis de posiciones
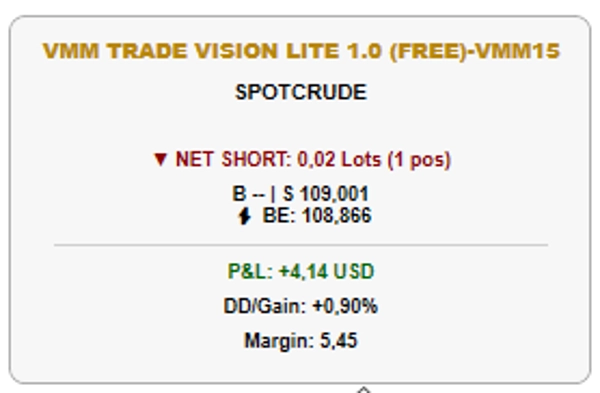
- **Posición NETA**: Muestra la exposición total larga/corta en lotes
- **Punto de equilibrio global**: Calcula el BE general considerando todas las posiciones, swaps y comisiones
- **Precios promedio de entrada**: Promedios individuales de compra/venta con ponderación completa por lote
- **Contador de posiciones activas**: Rastrea cuántas posiciones están abiertas
### 📈 Métricas de rendimiento
- **P&L en tiempo real**: Ganancias/pérdidas en vivo en la moneda de la cuenta
- **Margen usado**: Cantidad actual de margen en la moneda de la cuenta
- **Drawdown/Ganancia**: Porcentaje respecto al saldo de la cuenta
### 🎨 Características visuales
- **Líneas horizontales**: Líneas opcionales en el gráfico para BE y promedios (solo referencia visual)
- **Estilos de línea personalizables**: Ancho, estilo y colores
- **Posicionamiento inteligente del panel**: 5 posiciones (TopLeft, TopRight, BottomLeft, BottomRight, BottomCenter)
- **Detección automática de tema**: Se adapta a modo oscuro/claro
- **Control de opacidad**: Ajusta la transparencia del panel (0-255)
---
## ⚙️ Parámetros
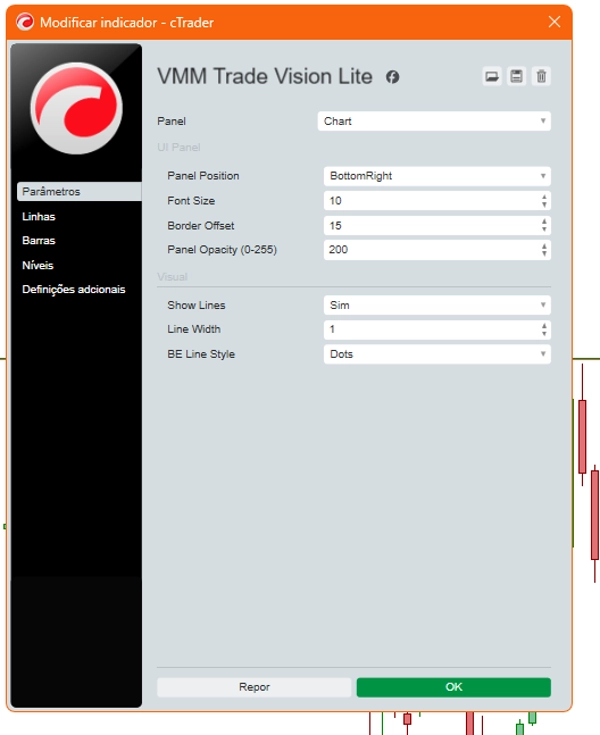
### Panel de interfaz
Parámetro | Descripción | Predeterminado
Posición del panel | Ubicación en pantalla para el panel de información | TopLeft
Tamaño de fuente | Tamaño del texto (9-12) | 10
Desplazamiento del borde | Distancia desde el borde de la pantalla | 15
Opacidad del panel | Nivel de transparencia (0-255) | 200
### Visual
Parámetro | Descripción | Predeterminado
Mostrar líneas | Mostrar líneas en el gráfico (solo visual) | true
Ancho de línea | Grosor de las líneas (1-3) | 1
Estilo de línea BE | Estilo de línea de punto de equilibrio | Dots
---
## 🚀 Cómo usar
1. Añade el indicador a cualquier gráfico **(solo lee datos)**
2. Abre posiciones manualmente en el símbolo **(tú decides cuándo operar)**
3. El panel muestra automáticamente **(solo para información)**:
- Dirección y tamaño de la posición NETA
- Precio de punto de equilibrio
- P&L actual
- Margen usado
4. **Usa esta información para tomar TUS PROPIAS decisiones de trading**
---
## 💡 Perfecto para
- **Scalpers** que rastrean múltiples entradas
- **Traders de posición** que gestionan carteras complejas
- **Estrategias de cobertura** con posiciones opuestas
- **Traders que quieren datos ANALÍTICOS claros sin automatización**
---
## 🔒 Gratis para siempre
Sin limitaciones, sin períodos de prueba. Herramienta completa de gestión de posiciones analítica/informativa disponible 100% GRATIS!
---
## ⚖️ DESCARGO DE RESPONSABILIDAD LEGAL
**VMM TRADE VISION LITE es solo una herramienta ANALÍTICA/INFORMATIVA.**
Al usar este indicador, reconoces que:
1. Este indicador no toma decisiones de trading automatizadas
2. Todas las decisiones de compra/venta son tu exclusiva responsabilidad
3. Este indicador no proporciona señales de trading ni asesoramiento financiero
4. Las métricas de rendimiento pasadas no garantizan resultados futuros
5. Operar en mercados financieros implica un riesgo sustancial de pérdida
**Opera siempre de manera responsable y nunca arriesgues más de lo que puedes permitirte perder.**
---
## 📈 Actualiza a ELITE
Obtén funciones adicionales premium **analíticas**:
- 🎯 Objetivo diario de ganancias con seguimiento de progreso
- 📊 Pivotes multitemporales (H1/H4/D1)
- 🔔 Notificaciones visuales inteligentes (alertas de objetivo/margen)
- ⚠️ Alerta crítica de nivel de margen (umbral configurable con codificación de colores)
- ⭐ Insignia de estado ELITE
*La versión ELITE también es solo ANALÍTICA/INFORMATIVA - sin ejecución de órdenes*
¡Busca **"VMM TRADE VISION ELITE"** en la tienda cTrader!
Resumen
Valoraciones de clientes
Conversación
Preguntas frecuentes
Más de este autor




![Logotipo de "Session Volume Profile (SVP) [Iridio Capital]"](https://cdn.ctrader.com/image/webp/b058beb7-b143-45f3-87d0-8c524c00b203_61552)










Precio