
SMCTimingIndicator
Chỉ báo
143 lượt tải
Phiên bản 1.0, Dec 2025
Windows, Mac
Mô tả
📜 Mô tả
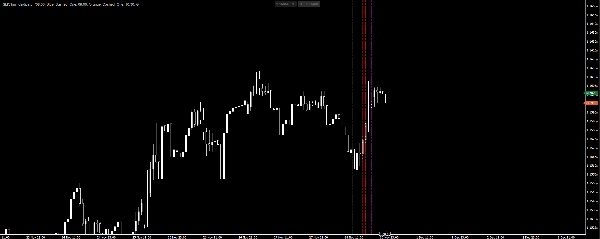
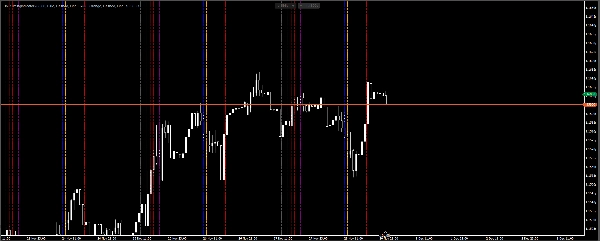
SMC Timing Indicator là một công cụ tùy chỉnh cho nền tảng cTrader giúp các nhà giao dịch hình dung thời gian trong ngày và cấu trúc phiên thị trường. Nó được thiết kế đặc biệt cho những người áp dụng Smart Money Concepts (SMC) và ICT strategies, nơi thời gian chính xác là rất quan trọng.
✨ Tính năng chính
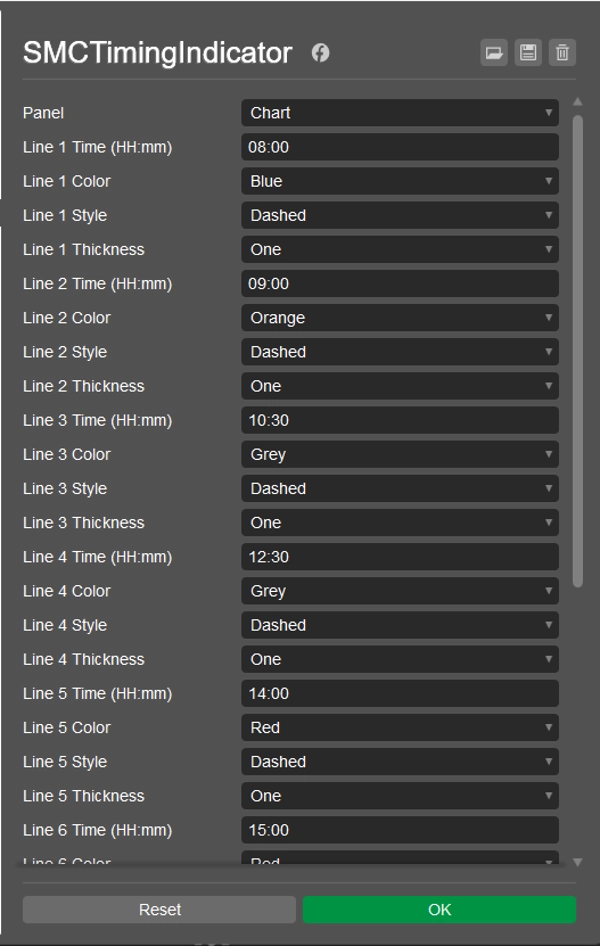
- Tối đa 8 đường thẳng đứng có thể cấu hình mỗi ngày
- Tùy chỉnh đầy đủ về thời gian, màu sắc, kiểu dáng và độ dày cho mỗi đường thẳng
- Tùy chọn hiển thị đường thẳng lịch sử qua các ngày giao dịch trước đó
- Tham số bù UTC để điều chỉnh múi giờ linh hoạt
- Kiến trúc sạch, mô-đun sử dụng enums, helpers và services
- Mã nguồn mở và miễn phí để sử dụng và chia sẻ
⚙️ Tham số
Mỗi đường thẳng có bộ tham số riêng (thời gian, màu sắc, kiểu dáng, độ dày), cho phép bạn tùy chỉnh chỉ báo theo nhu cầu giao dịch của mình.
📈 Cách sử dụng
- Cài đặt chỉ báo trong cTrader Automate.
- Cấu hình thời gian và kiểu dáng cho các đường thẳng của bạn.
- Điều chỉnh bù UTC để phù hợp với múi giờ địa phương hoặc thời gian máy chủ của nhà môi giới.
- Bật Hiển thị Đường Lịch Sử để hình dung thời gian các phiên trước.
📦 Giấy phép
Được phát hành theo Giấy phép MIT – miễn phí sử dụng, chỉnh sửa và phân phối.
Tóm tắt
Tóm tắt AI
SMC Timing Indicator is a customizable indicator for the cTrader platform designed to mark trading sessions with vertical lines. It supports up to eight configurable vertical lines per day, each with adjustable time, color, style, and thickness settings. The indicator includes a UTC offset parameter to align session times with different time zones or broker server times. Users can enable the display of historical session lines to visualize past trading days. The tool is particularly suited for traders using Smart Money Concepts (SMC) and ICT strategies, where precise intraday timing and market session structure visualization are important. It features a modular architecture and is published under the MIT License, allowing free use, modification, and distribution. Installation and configuration are done through cTrader Automate.
Hồ sơ chỉ báo
Đánh giá của khách hàng
0.0
Đánh giá: 0
Đánh giá của khách hàng
Sản phẩm này chưa có đánh giá nào. Bạn đã dùng thử chưa? Hãy là người đầu tiên chia sẻ với mọi người!
Thảo luận
Câu hỏi thường gặp
Forex
EURUSD
SMC
Các sản phẩm có sẵn trên cTrader Store, bao gồm bot giao dịch, chỉ báo và plugin, được cung cấp bởi các nhà phát triển bên thứ ba và chỉ nhằm mục đích cung cấp thông tin và tiếp cận kỹ thuật. cTrader Store không phải là nhà môi giới và không cung cấp lời khuyên đầu tư, khuyến nghị cá nhân hay bất kỳ đảm bảo nào về hiệu suất trong tương lai.
Sản phẩm khác của tác giả này


![Logo "[Hamster-Coder] Moving Average MTF"](https://cdn.ctrader.com/image/webp/b11b98b1-194d-4b8e-b00e-d611826ad159_31226)


Giá
Kể từ 24/09/2025
369
Cài đặt miễn phí