
Mô tả
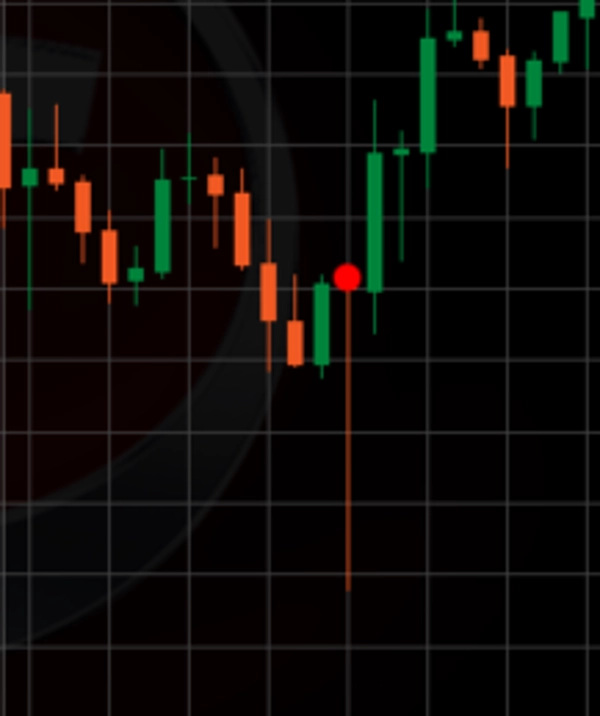
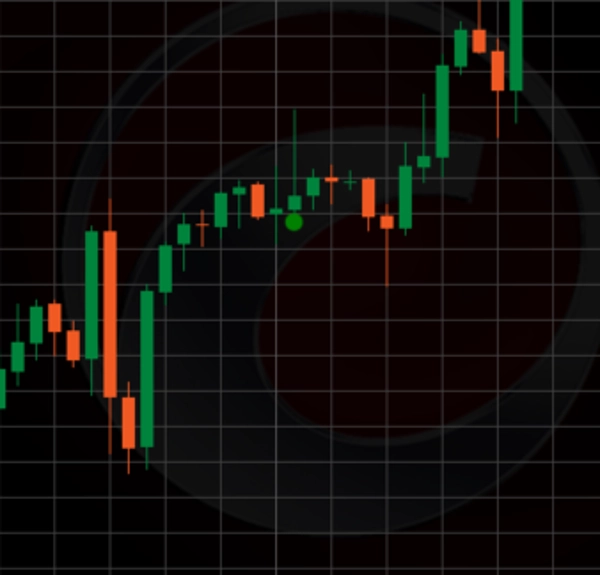
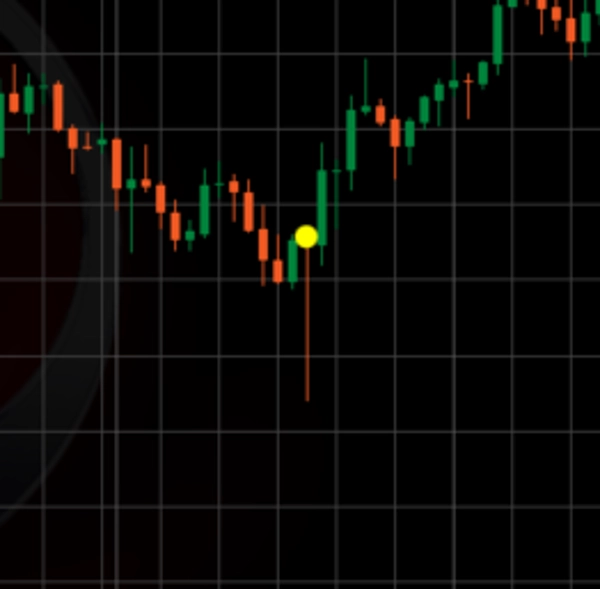
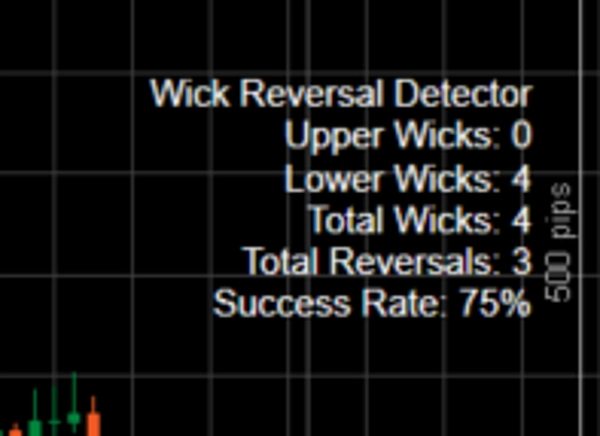
Chỉ báo Long Wick là một công cụ phân tích kỹ thuật mạnh mẽ được xây dựng cho cTrader, tập trung vào việc xác định các cây nến có bấc dài bất thường—dù là bấc trên hay dưới—so với kích thước thân nến và phạm vi nến trung bình. Nó làm nổi bật những bấc này trên biểu đồ như các điểm đảo chiều tiềm năng, nơi thị trường có thể đã từ chối mức giá cao hơn (đối với bấc trên, gợi ý đảo chiều giảm) hoặc mức giá thấp hơn (đối với bấc dưới, gợi ý đảo chiều tăng). Chỉ báo sử dụng sự kết hợp của hệ số ngưỡng bấc, tỷ lệ bấc-thân tối thiểu và Đường Trung Bình Động Đơn Giản (SMA) lọc xu hướng để loại bỏ nhiễu và tập trung vào các mẫu từ chối giá quan trọng. Mỗi bấc được phát hiện sẽ được đánh dấu bằng một vòng tròn (màu xanh lá cho bấc trên, màu đỏ cho bấc dưới nếu được xác nhận là đảo chiều, hoặc màu vàng nếu không), và dữ liệu thống kê (ví dụ: tổng số bấc, đảo chiều và tỷ lệ thành công) được hiển thị trên biểu đồ để dễ dàng theo dõi.
Cách sử dụng trong giao dịch:
- Xác định cơ hội đảo chiều: Sử dụng chỉ báo để phát hiện các bấc dài xuất hiện tại các mức hỗ trợ hoặc kháng cự quan trọng, hoặc ngược với xu hướng hiện tại (ví dụ: bấc dưới dài trong xu hướng giảm cho khả năng đảo chiều tăng). Một vòng tròn màu xanh lá hoặc đỏ chắc chắn cho thấy đảo chiều được xác nhận dựa trên hành động giá trong khoảng thời gian lookforward, tạo thành tín hiệu để cân nhắc vào lệnh theo hướng ngược lại (ví dụ: mua khi đảo chiều bấc dưới đỏ, bán khi đảo chiều bấc trên xanh lá).
- Xác nhận với các công cụ khác: Kết hợp chỉ báo Long Wick với các chỉ báo kỹ thuật khác (ví dụ: RSI, MACD hoặc các đường hỗ trợ/kháng cự) để xác nhận tín hiệu đảo chiều và tránh các tín hiệu sai, đặc biệt trong các thị trường biến động mạnh.
- Quản lý rủi ro: Đặt lệnh dừng lỗ vượt qua điểm cực của bấc (ví dụ: dưới mức thấp cho đảo chiều tăng) để bảo vệ khỏi khả năng đảo chiều thất bại, và đặt mức chốt lời dựa trên hỗ trợ/kháng cự gần đó hoặc tỷ lệ rủi ro-lợi nhuận (ví dụ: 1:2).
- Theo dõi tỷ lệ thành công: Thường xuyên kiểm tra tỷ lệ thành công được hiển thị để đánh giá hiệu quả của chỉ báo theo thời gian và điều chỉnh chiến lược phù hợp.
Điều chỉnh tham số để sử dụng hiệu quả nhất:
- Khoảng thời gian lookback (Mặc định: 5): Xác định số thanh được sử dụng để tính phạm vi nến trung bình. Khoảng thời gian ngắn hơn (ví dụ: 3-10) làm cho chỉ báo nhạy hơn với biến động gần đây, phù hợp với thị trường di chuyển nhanh, trong khi khoảng thời gian dài hơn (ví dụ: 20-50) làm mượt trung bình cho điều kiện xu hướng rõ ràng hơn. Điều chỉnh theo khung thời gian của bạn (ví dụ: thấp hơn cho biểu đồ 1 phút, cao hơn cho biểu đồ 1 giờ).
- Khoảng thời gian lookforward (Mặc định: 15): Xác định số thanh để xác nhận đảo chiều. Khoảng thời gian ngắn hơn (ví dụ: 5-10) phù hợp với chiến lược scalping nhanh, trong khi khoảng thời gian dài hơn (ví dụ: 15-30) phù hợp cho swing trading để bắt các đảo chiều kéo dài. Tăng nếu bạn nhận thấy quá nhiều dấu hiệu màu vàng khi đảo chiều xảy ra muộn hơn.
- Hệ số ngưỡng bấc (Mặc định: 1.3): Nhân phạm vi nến trung bình để đặt chiều dài bấc tối thiểu. Giá trị thấp hơn (ví dụ: 1.0-1.5) phát hiện nhiều bấc hơn (hữu ích trong thị trường ít biến động), trong khi giá trị cao hơn (ví dụ: 2.0-3.0) lọc chỉ những bấc quan trọng nhất (tốt hơn trong thị trường biến động cao). Điều chỉnh để cân bằng giữa độ nhạy và chất lượng tín hiệu.
- Khoảng thời gian xu hướng (SMA) (Mặc định: 21): Xác định độ dài SMA để lọc xu hướng. Khoảng thời gian ngắn hơn (ví dụ: 10-20) phản ứng với xu hướng ngắn hạn, trong khi khoảng thời gian dài hơn (ví dụ: 50-100) phù hợp với xu hướng dài hạn. Điều chỉnh để phù hợp với tầm nhìn giao dịch và điều kiện thị trường của bạn.
- Tỷ lệ bấc so với thân tối thiểu (Mặc định: 3): Đặt tỷ lệ tối thiểu giữa chiều dài bấc và kích thước thân nến. Tỷ lệ thấp hơn (ví dụ: 2-3) bao gồm nhiều nến có bấc vừa phải hơn, trong khi tỷ lệ cao hơn (ví dụ: 4-5) tập trung vào các nến có bấc rất rõ rệt. Tăng để có tín hiệu đảo chiều nghiêm ngặt hơn, giảm để có nhiều cơ hội hơn.
- Dung sai đảo chiều (Pips) (Mặc định: 5): Cho phép dung sai tính bằng pips để giá có thể vượt qua điểm cực của bấc trước khi loại bỏ đảo chiều. Giá trị nhỏ hơn (ví dụ: 2-3) đảm bảo xác nhận đảo chiều nghiêm ngặt, trong khi giá trị lớn hơn (ví dụ: 5-10) cho phép các đợt điều chỉnh nhỏ. Điều chỉnh dựa trên giá trị pip và biến động của ký hiệu.
Mẹo tối ưu hóa:
- Bắt đầu với các thiết lập mặc định và kiểm tra lại trên dữ liệu lịch sử cho công cụ và khung thời gian bạn ưu tiên.
- Trong thị trường có xu hướng, tăng Hệ số ngưỡng bấc và Tỷ lệ bấc so với thân tối thiểu để tập trung vào các tín hiệu đảo chiều mạnh hơn.
- Trong thị trường đi ngang, giảm các tham số này để bắt nhiều bấc hơn, nhưng kết hợp với khoảng thời gian lookforward ngắn hơn để tránh loại bỏ tín hiệu muộn.
- Thường xuyên xem xét tỷ lệ thành công và điều chỉnh tham số nếu nó giảm xuống dưới ngưỡng chấp nhận của bạn (ví dụ: 70%).
Bằng cách tùy chỉnh các tham số này, các nhà giao dịch có thể điều chỉnh chỉ báo Long Wick phù hợp với chiến lược cụ thể của mình, nâng cao hiệu quả trong việc phát hiện các điểm đảo chiều có xác suất cao trong nhiều điều kiện thị trường khác nhau.
Tóm tắt
Traders can use the indicator to spot reversal opportunities at key support or resistance levels or against prevailing trends. It is recommended to confirm signals with other technical tools such as RSI or MACD and to apply risk management by placing stop-loss orders beyond wick extremes. The indicator’s parameters—including lookback and lookforward periods, wick threshold multiplier, SMA trend period, minimum wick-to-body ratio, and reversal tolerance—are adjustable to suit different market conditions and trading styles. Regular review of the success rate helps optimize performance.
Đánh giá của khách hàng
5 | 0 % | |
4 | 100 % | |
3 | 0 % | |
2 | 0 % | |
1 | 0 % |


