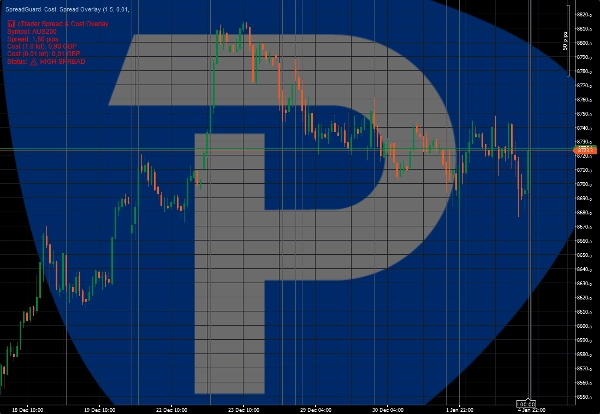
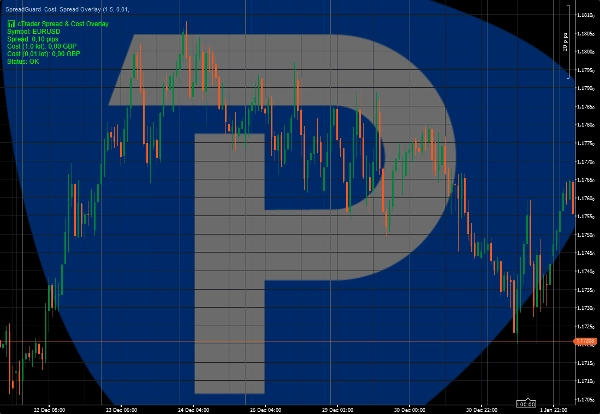
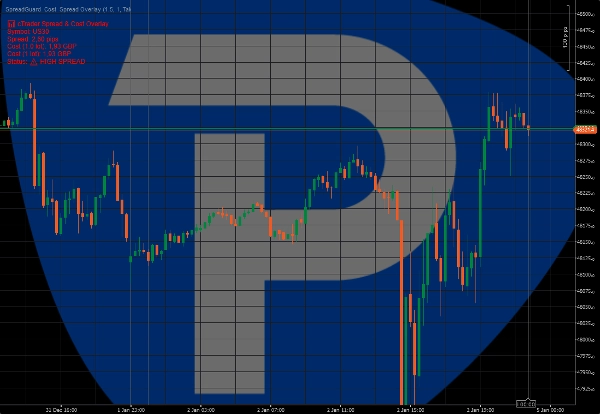
Логотип продукта "SpreadGuard  Cost  Spread Overlay"
SpreadGuard Cost Spread Overlay
Загруженное изображение продукта "SpreadGuard  Cost  Spread Overlay"
С 02/01/2026

cTrader Spread & Cost Overlay is a lightweight indicator designed to visualize real-time trading costs directly on the chart.

The indicator shows the current spread in pips and calculates the estimated cost of a trade based on the selected lot size. A visual warning highlights periods of high spread, helping traders avoid unfavorable execution conditions.

Key features:
• Live spread display (pips)
• Estimated trade cost for selected lot size
• Visual warning when spread exceeds a defined threshold
• Clean on-chart overlay

This indicator does not place trades or generate trading signals.
It is intended as an execution and risk-awareness tool for manual traders.

Suitable for scalpers, intraday traders, and prop firm accounts.

*Early access price. Future updates may be released at a higher regular price.

Профиль индикатора
0.0
Отзывы: 0
Отзывы покупателей
У этого продукта еще нет отзывов. Уже попробовали его? Поделитесь впечатлениями!
Prop
Forex
EURUSD
ATR
GBPUSD
Продукты, доступные в cTrader Store, включая торговых ботов, индикаторы и плагины, предоставляются сторонними разработчиками и доступны исключительно в информационных и технических целях. cTrader Store не является брокером и не предоставляет инвестиционные консультации, персональные рекомендации или какие-либо гарантии будущей доходности.

Больше от этого автора

Visual session structure showing Asia, London and New York high/low ranges directly on the chart.
Visual warning zones for high-impact news so you can manage risk before volatility hits.

Вам также может понравиться

High-Performance Renko Chart Indicator with Advanced AI Filtering
Логотип продукта "JMA"
$ 19
Jurik Moving Average (Jurik's Moving Average) triple adaptive filter with unique Jurik smoothing and dynamic factor.
BoS and ChoCh are useful for detecting Market structural points.
📊Market Structure, Swing Levels, Order Blocks & Liquidity Zones (2Tops/2Bottoms). Smart Money approach. 🚀"*
Trend-coloring Donchian cloud that highlights volatility squeezes and breakouts.
BB20 MULTICOLOR
Trend Cycle – measure the life of your trends. See how long the current move has been running and how long similar trend
Price Level DWM BT
All-in-One ICT/SMC Institutional Framework — Ranges, Structure, Liquidity, Fibonacci & Time Engine.
Логотип продукта "RSI Advanced"
$ 20
/
$30
The standard Relative Strength Index (RSI), RSI & Signal Cloud, Smart Volatility Filter (ATR), On-Chart Info Dashboard
cTrader ZigZag Alerts: Precision Swing Detection, Alerts, and Fibonacci.
VolumeProfileSuite is an advanced and flexible Volume Profile indicator for cTrader.
Advanced RSI Indicator with multi-MA smoothing, Bollinger Bands, divergence detection, and fill zones for cTrader.
Simple MACD Histogram with color-coded rising (green) and falling (red) momentum bars.
setup tabajara
A comprehensive workflow‑enhancement toolkit designed to make charting on cTrader smoother, clearer, and more efficient.
Counts bars from the start of the sessions.
SMA Cross Signal – Simple Moving Average Crossover with Visual Alerts (FREE)
С 02/01/2026