Описание
Интеллектуальная система обнаружения/прогнозирования фаз macd Часть системы 2 из 3
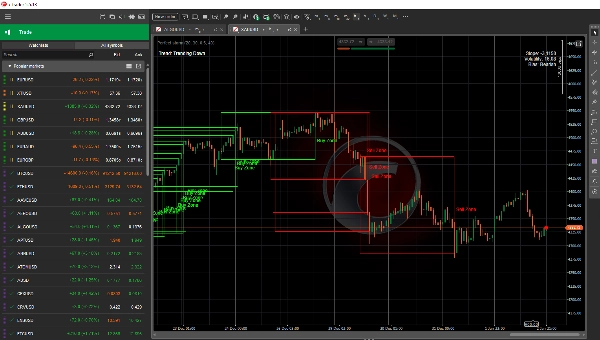
PERFECT STORM DAY TREND CLASSIFIER™
Точная структура рынка. Интеллект тренда в реальном времени. Осведомленность о пробоях.
Профессиональный продукт
Day Trend Classifier™ — это движок структуры рынка следующего поколения, разработанный для трейдеров, которым нужна ясность, точность и информация о внутридневном поведении тренда в реальном времени. Основанный на адаптивном анализе волатильности, обнаружении тренда на основе наклона и интеллектуальном отображении пробоев, этот индикатор превращает необработанные ценовые движения в чистый, выразительный и действенный визуальный рассказ.
Независимо от того, торгуете ли вы внутридневно, свингом или алгоритмически, Day Trend Classifier™ дает вам то, что нужно каждому трейдеру:
мгновенное понимание того, что рынок делает прямо сейчас — и что он готовится сделать дальше.
Основные возможности
Обнаружение состояния тренда в реальном времени
Индикатор непрерывно оценивает структуру рынка и классифицирует поведение дня в четыре интуитивно понятных режима:
Восходящий тренд
Нисходящий тренд
Боковой / нейтральный
Фаза накопления (сжатие в узком диапазоне перед расширением)
Чистая метка на графике всегда держит вас в курсе.
Выразительная визуальная обратная связь
Ваш график становится тактической панелью управления:
Мигающая точка тренда
Лайм для бычьего тренда
Красный для медвежьего тренда
Желтый для накопления
Серый для нейтрального состояния
Полоса измерения тренда
Динамическая полоса силы, которая визуально передает импульс и ясность тренда.
Информационный блок
Отображает наклон, волатильность и направленную склонность в реальном времени.
Это не просто данные — это визуализированный рыночный интеллект.
Интеллектуальное отображение зон пробоя
Day Trend Classifier™ определяет условия пробоя и автоматически рисует:
Зоны покупки при пробоях вверх
Зоны продажи при пробоях вниз
Каждая зона включает:
Полупрозрачную затененную область
Жирные структурные границы
Четкую метку «Зона покупки» или «Зона продажи»
Проецируемое вперед расширение для будущих ретестов
Эти зоны показывают, откуда началось движение — и где часто происходят ретесты с высокой вероятностью.
Почему это работает
Понимайте дневной тренд с первого взгляда
Определяйте накопление перед расширением
Автоматически видьте происхождение пробоев и зоны ретестов
Торгуйте с уверенностью, используя показатели волатильности и наклона в реальном времени
Работает на любом таймфрейме, с любым символом, на любом рынке
Чистый, выразительный и созданный для профессионального рабочего процесса
Это не очередной индикатор скользящей средней.
Это движок структуры рынка, который превращает внутридневной хаос в ясность.
Для кого ??.....
Внутридневные трейдеры, которым нужна осведомленность о тренде в реальном времени
Свинг-трейдеры, которые хотят избежать входа в состояние истощения
Алгоритмические трейдеры, которым нужна чистая, детерминированная логика
Трейдеры, работающие с ценовым действием, которые полагаются на структуру, зоны и волатильность
Все, кто хочет понять истинные намерения рынка
Примечания
Это часть системы 2/3, для полной производительности нужны все 3 части
Дополнительная часть 4 также доступна, где вы получаете продвинутые уровни поддержки и сопротивления на основе ценового действия
⭐PERFECT STORM DAY TREND CLASSIFIER™
Торгуйте днем с ясностью. Торгуйте трендом с уверенностью.