Mô tả
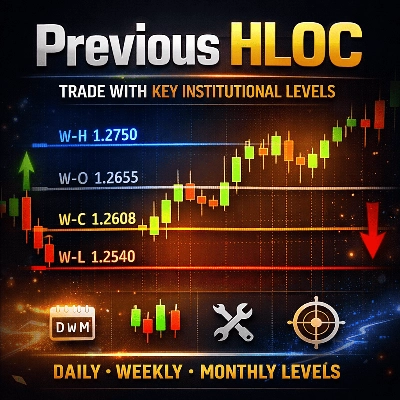
Previous HLOC – Các Mức Thời Gian Cao Hơn Thông Minh cho Giao Dịch Chính Xác
Previous HLOC là một chỉ báo đa khung thời gian chuyên nghiệp vẽ các mức Cao, Thấp, Mở và Đóng của kỳ trước trực tiếp trên biểu đồ của bạn với độ rõ nét và tùy chỉnh vượt trội.
Được thiết kế cho các nhà giao dịch theo hành động giá, scalper, nhà giao dịch trong ngày và nhà giao dịch swing, chỉ báo này giúp bạn nhanh chóng xác định các mức quan trọng của tổ chức thường đóng vai trò như vùng hỗ trợ, kháng cự, vùng từ chối và mục tiêu thanh khoản.
Tại sao chọn Previous HLOC?
Thị trường luôn phản ứng với các mức ngày, tuần và tháng trước đó. Các tổ chức, thuật toán và nhà giao dịch chuyên nghiệp theo dõi chặt chẽ những mức này.
Previous HLOC đưa những mức giá quan trọng đó lên biểu đồ của bạn một cách sạch sẽ, không gây xao nhãng—để bạn không bao giờ bỏ lỡ chúng.
Tính Năng Chính
✅ Các Mức Đa Khung Thời Gian
- Chọn mức nến trước hàng ngày, hàng tuần, hàng tháng hoặc hàng giờ
- Các mức vẫn chính xác bất kể khung thời gian biểu đồ của bạn
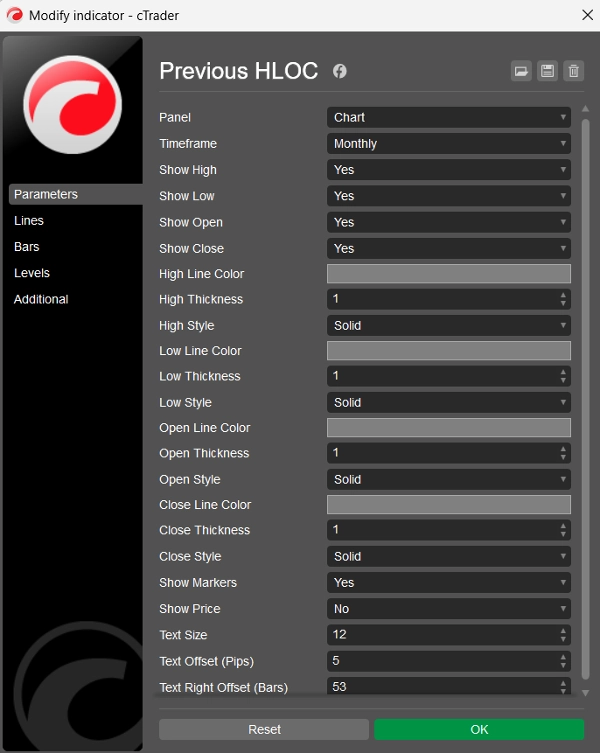
✅ Kiểm Soát Toàn Bộ HLOC
- Bật hoặc tắt Cao, Thấp, Mở, Đóng riêng lẻ
- Chỉ giao dịch những gì quan trọng với chiến lược của bạn
✅ Tùy Chỉnh Nâng Cao
- Tách biệt màu sắc, độ dày và kiểu đường cho mỗi mức
- Các dấu hiệu font Consolas sạch sẽ với kích thước chữ có thể điều chỉnh
- Hiển thị giá tùy chọn bên cạnh mỗi dấu hiệu
✅ Dấu Hiệu Nổi Thông Minh
- Dấu hiệu di chuyển tự nhiên cùng biểu đồ
- Luôn căn chỉnh với mức giá khi cuộn
- Được đặt ở bên phải để dễ nhìn
✅ Các Mức Dự Báo Tương Lai
- Đường kéo dài xa vào tương lai
- Lý tưởng cho lập kế hoạch vào lệnh, thoát lệnh, dừng lỗ và chốt lời
🔹 Cách Các Nhà Giao Dịch Sử Dụng
📌 Xác định hỗ trợ & kháng cự intraday mạnh mẽ
📌 Sử dụng mức Cao/Thấp trước đó như vùng quét thanh khoản
📌 Giao dịch phá vỡ, từ chối và kiểm tra lại
📌 Căn chỉnh vào lệnh với xu hướng khung thời gian cao hơn
📌 Cải thiện độ chính xác rủi ro - lợi nhuận
🔹 Chỉ Báo Này Dành Cho Ai?
✔ Nhà giao dịch Forex
✔ Nhà giao dịch chỉ số & hàng hóa
✔ Scalper và nhà giao dịch trong ngày
✔ Nhà giao dịch swing
✔ Nhà giao dịch hành động giá & SMC
🔹 Sạch. Nhanh. Đáng tin cậy.
- Không vẽ lại
- Không trễ
- Không lộn xộn
- Hoạt động trên tất cả các ký hiệu và tất cả các khung thời gian
🔹 Tóm Tắt
Previous HLOC không chỉ là một chỉ báo mức thông thường—nó là một công cụ giao dịch chuyên nghiệp giúp bạn giao dịch với bối cảnh, cấu trúc và sự tự tin.
Nếu bạn giao dịch quanh các mức phiên trước, chỉ báo này thuộc về biểu đồ của bạn.
Tóm tắt
Đánh giá của khách hàng
5 | 100 % | |
4 | 0 % | |
3 | 0 % | |
2 | 0 % | |
1 | 0 % |


