Описание
LogicLadder Pivots – Продвинутый сканер рыночной структуры и паттернов
Откройте скрытую структуру рынка с LogicLadder Pivots.
Индикатор LogicLadder Pivots — это профессиональный инструмент для анализа ценового действия, предназначенный для помощи трейдерам в визуализации рыночной структуры, выявлении трендов и автоматическом обнаружении паттернов с высокой вероятностью разворота. Объединяя классическую логику ZigZag с продвинутым мониторингом на нескольких таймфреймах, этот инструмент выступает в роли вашего личного рыночного аналитика, сохраняя графики чистыми и одновременно оповещая о критических движениях цены.
🚀 Ключевые особенности
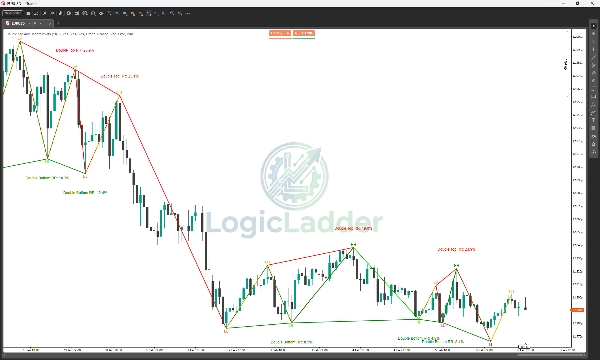
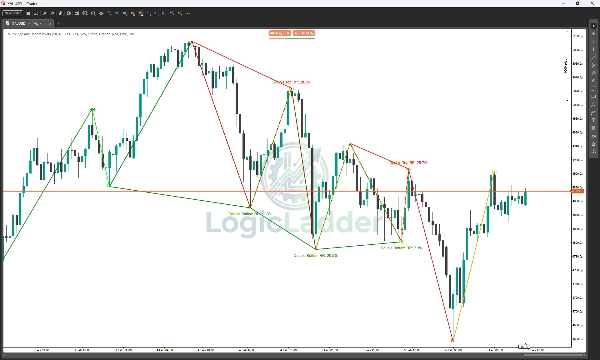
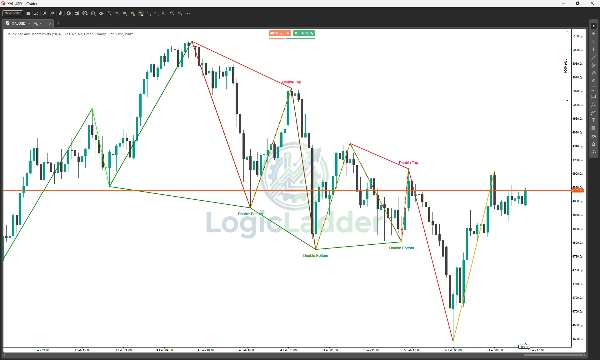
- Автоматическая рыночная структура: Автоматически маркирует Higher Highs (HH), Lower Highs (LH), Higher Lows (HL) и Lower Lows (LL), предоставляя мгновенное понимание текущего направления тренда.
- Умное обнаружение паттернов: Сканирует в реальном времени на наличие Double Top и Double Bottom форм. Он не просто находит паттерны, но и фильтрует их на основе рассчитанного соотношения риск/прибыль (RR), чтобы вы видели только самые перспективные сигналы.
- Оповещения на нескольких таймфреймах (MTF): Следите за более высоким таймфреймом (например, H4 или Daily), торгуя на более низком. Индикатор оповестит вас, когда ключевые поворотные точки сформируются на выбранном таймфрейме, гарантируя, что вы не будете торговать против основного тренда.
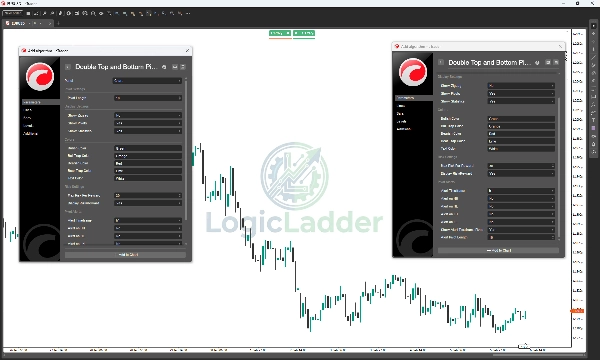
- Интерактивная панель статистики: Чистая панель на графике отображает текущий статус обнаружения паттернов (Сканирование, Обнаружен Double Top и т.д.).
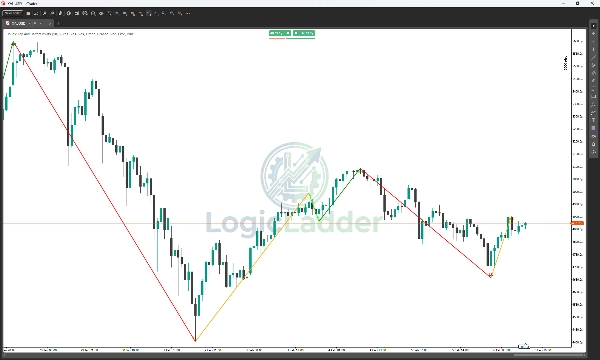
- Визуализация ZigZag: Рисует четкие, настраиваемые линии тренда, которые отсекают шум, помогая сосредоточиться на значимых ценовых колебаниях.
- Полная настройка: Настраивайте каждый аспект индикатора под свой стиль торговли. Регулируйте чувствительность поворотов (Length), меняйте цвета для бычьей/медвежьей структуры и включайте или отключайте отдельные визуальные элементы.
🎨 Визуальное руководство и цветовая стратегия
Система LogicLadder использует специфическую 4-цветовую кодировку, чтобы мгновенно рассказать вам историю рыночной структуры. Вот как читать "Лестницу":
1. 🟢 Зеленый (Бычий - Сильный)
- Что это: Используется для Higher Highs (HH).
- Что это значит: Покупатели полностью контролируют рынок. Рынок достигает новых максимумов.
- Действие: Ищите возможности для покупки или удерживайте существующие длинные позиции.
2. 🔴 Красный (Медвежий - Сильный)
- Что это: Используется для Lower Lows (LL).
- Что это значит: Продавцы полностью контролируют рынок. Рынок падает до новых минимумов.
- Действие: Ищите возможности для продажи или удерживайте существующие короткие позиции.
3. 🟠 Оранжевый (Бычья ловушка - Слабость)
- Что это: Используется для Lower Highs (LH).
- Что это значит: Покупатели пытались поднять цену, но не смогли пробить предыдущий максимум. Это "бычья ловушка" — поздние покупатели теперь зажаты, так как импульс ослабевает.
- Действие: Предупреждающий сигнал! Если вы в лонге, рассмотрите возможность фиксации прибыли. Следите за потенциальным разворотом тренда вниз.
4. 🟢 Лайм (Медвежья ловушка - Сила)
- Что это: Используется для Higher Lows (HL).
- Что это значит: Продавцы пытались опустить цену, но не смогли пробить предыдущий минимум. Это "медвежья ловушка" — поздние продавцы зажаты, так как поддержка держится.
- Действие: Сигнал возможности! Часто это означает начало нового восходящего тренда. Следите за сигналами входа в лонг.
📉 Как торговать по "Лестнице"
- Режим восходящего тренда: Вы хотите видеть паттерн из Зеленого (HH), соединенного с Лаймом (HL). Это подтверждает здоровую восходящую лестницу.
- Режим нисходящего тренда: Вы хотите видеть паттерн из Красного (LL), соединенного с Оранжевого (LH). Это подтверждает резкую нисходящую лестницу.
- Обнаружение разворотов:
-
- Потенциальный максимум: Если вы видите Зеленый (HH), за которым сразу следует Оранжевый (LH), восходящий тренд теряет силу.
- Потенциальный минимум: Если вы видите Красный (LL), за которым сразу следует Лайм (HL), давление продавцов иссякает.
💡 Как это работает
- Анализ поворотов: Индикатор анализирует заданный пользователем период обратного просмотра (по умолчанию: 10 баров) для выявления значимых локальных максимумов и минимумов.
- Логика тренда: Он соединяет эти точки, визуализируя "Лестницу" цены — показывая вам точно, когда тренд ломает структуру или уважает поддержку/сопротивление.
- Подтверждение разворота: Когда ценовое действие формирует структуру "W" (Double Bottom) или "M" (Double Top), соответствующую вашим критериям риск/прибыль, индикатор рисует паттерн на графике и обновляет панель статуса.
🔔 Оповещения и уведомления
Оставайтесь в курсе, не уставившись в экран. LogicLadder Pivots включает надежную систему оповещений:
- Лог оповещений: Подробные сообщения выводятся в лог cTrader при возникновении паттернов или поворотных точек.
- Мониторинг MTF: Получайте уведомления, когда на выбранном таймфрейме оповещения формируется структурный Pivot High или Low (например, оповещение о 4-часовом Pivot Low при скальпинге на 5-минутном графике).
⚙️ Параметры
- Длина поворота: Чувствительность обнаружения колебаний.
- Смещение меток: Регулирует расстояние текстовых меток от теней свечей для лучшей видимости.
- Максимальный риск на прибыль: Фильтрует паттерны по эффективности (по умолчанию: 30%).
- Таймфрейм оповещений: Выберите дополнительный таймфрейм для мониторинга.
- Визуальные настройки: Полный контроль над цветами для бычьих, медвежьих и ловушечных движений.
Сводка
The indicator detects Double Top and Double Bottom reversal patterns in real-time, filtering them by a calculated Risk-to-Reward ratio to highlight the most actionable setups. It supports alerts for pivot formations on higher timeframes while trading on lower ones, helping users align trades with major trends.
A customizable on-chart stats panel displays the current pattern detection status, and clear ZigZag trend lines visualize significant price swings. Users can adjust pivot sensitivity, label positioning, and color schemes for bullish, bearish, and trap moves to fit their trading style.
The tool employs a four-color system to represent market conditions: green for strong bullish moves (HH), red for strong bearish moves (LL), orange for bull traps (LH), and lime for bear traps (HL). This visual guide aids in spotting trend continuations and potential reversals. Alerts include detailed log messages and MTF notifications to keep traders informed.