
Mô tả
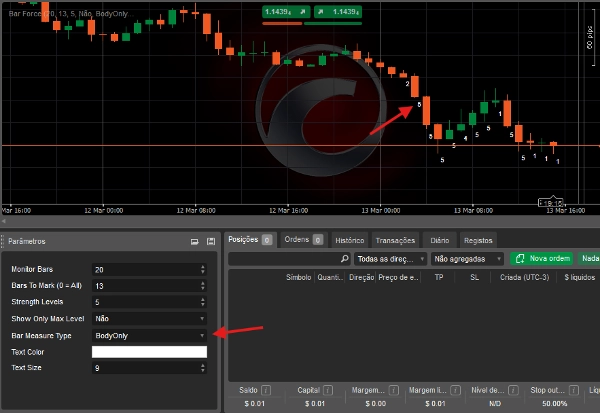
Bar Force là một chỉ báo phân tích sức mạnh thanh giúp các nhà giao dịch nhanh chóng xác định các thời điểm mở rộng biến động và động lượng thị trường.
Chỉ báo tự động phân loại từng thanh dựa trên sức mạnh tương đối so với các thanh trước đó, hiển thị một giá trị số trực tiếp trên biểu đồ. Điều này giúp dễ dàng phát hiện các nến yếu, trung bình hoặc cực kỳ mạnh trong bối cảnh thị trường gần đây.
Phiên bản Đầy đủ cung cấp quyền kiểm soát hoàn toàn các tham số phân tích, cho phép các nhà giao dịch điều chỉnh chỉ báo phù hợp với các thị trường, khung thời gian và phong cách giao dịch khác nhau.
Các tính năng chính
✔ Phân loại sức mạnh thanh tự động
✔ Dựa trên biến động thị trường gần đây
✔ Hiển thị trực tiếp trên biểu đồ để phân tích nhanh bằng mắt
✔ Lý tưởng cho Giao dịch Price Action, Breakout và Momentum
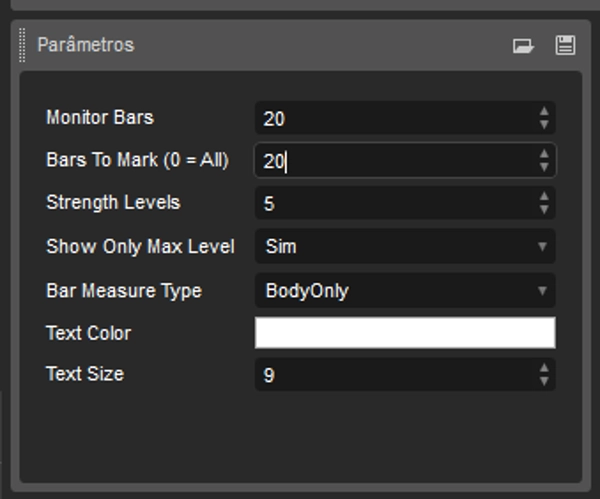
Các tham số có thể cấu hình
Phiên bản đầy đủ cung cấp khả năng tùy chỉnh hoàn toàn.
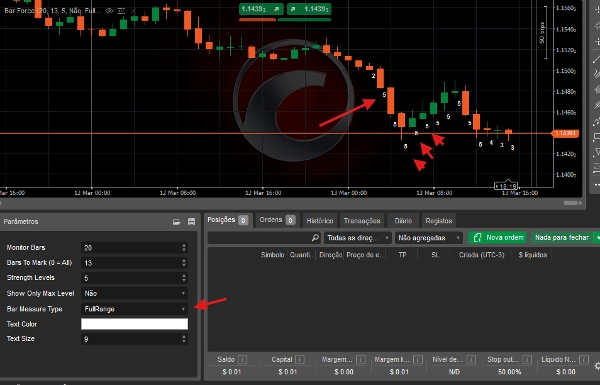
Loại đo lường thanh
Người dùng có thể chọn cách tính sức mạnh của mỗi thanh:
- Phạm vi đầy đủ – sử dụng toàn bộ phạm vi của nến (Cao – Thấp)
- Chỉ thân nến – chỉ sử dụng thân nến (Mở – Đóng)
Điều này cho phép chỉ báo được sử dụng cho cả phân tích biến động và phân tích sức mạnh định hướng.
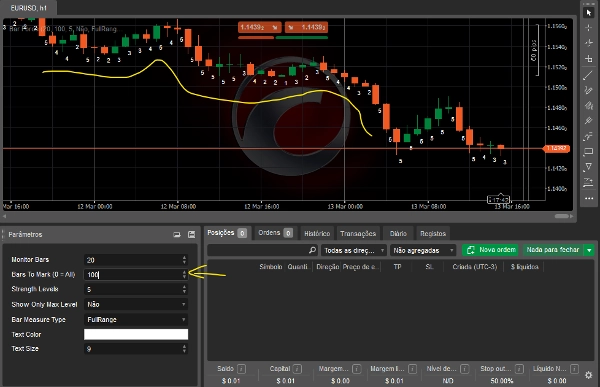
Phạm vi giám sát
Xác định số lượng thanh trước đó được sử dụng để tính trung bình sức mạnh thị trường.
Ví dụ:
- 50 thanh
- 100 thanh
- 200 thanh
Điều này cho phép chỉ báo thích ứng với các điều kiện thị trường khác nhau.
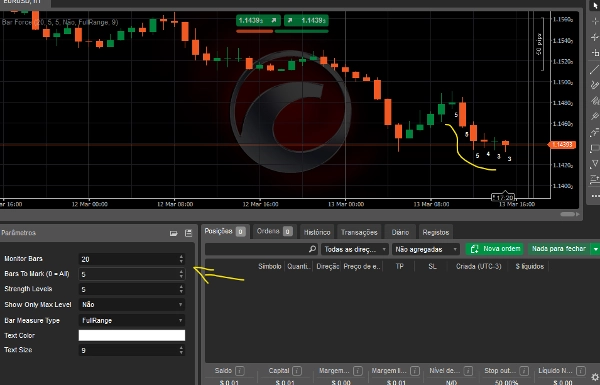
Số lượng thanh hiển thị
Các nhà giao dịch có thể chọn số lượng thanh gần đây sẽ hiển thị phân loại sức mạnh trên biểu đồ.
Ví dụ:
- 5 thanh cuối
- 20 thanh cuối
- hoặc toàn bộ lịch sử
Thang đo sức mạnh
Xác định số cấp độ phân loại được sử dụng.
Ví dụ:
- thang đo từ 1 đến 3
- thang đo từ 1 đến 5
- hoặc phạm vi tùy chỉnh
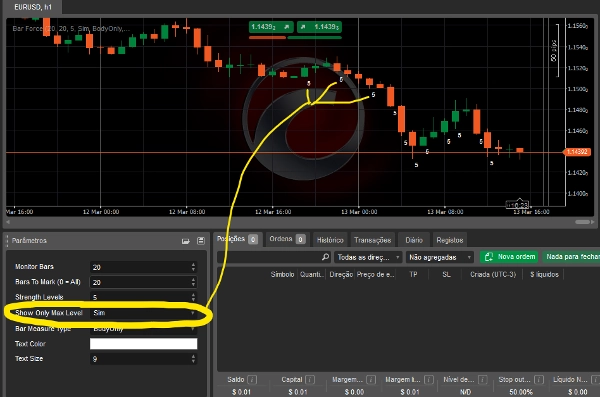
Bộ lọc cấp độ tối đa
Tùy chọn chỉ hiển thị các thanh đạt cấp độ sức mạnh tối đa, giúp dễ dàng xác định các sự kiện động lượng mạnh.
Tùy chỉnh hình ảnh
Người dùng cũng có thể điều chỉnh:
- màu chữ
- kích thước chữ
cho phép chỉ báo phù hợp với bố cục biểu đồ của họ.
Chỉ báo này dành cho ai?
- Các nhà giao dịch Price Action
- Các nhà giao dịch Breakout
- Các nhà giao dịch muốn xác định động lượng và sự mở rộng biến động
Bar Force biến phân tích nến bằng mắt thành một phân loại sức mạnh khách quan, giúp các nhà giao dịch nhanh chóng nhận diện các cơ hội tiềm năng trên thị trường.
Tóm tắt
Đánh giá của khách hàng
5 | 67 % | |
4 | 33 % | |
3 | 0 % | |
2 | 0 % | |
1 | 0 % |