
Dominator M4tr1x
Đây là một công cụ thông tin cơ bản kết hợp phân tích cấu trúc giá smart-money trên biểu đồ với nhiều bảng điều khiển thông tin. Dưới đây là phân tích từng hệ thống chính:
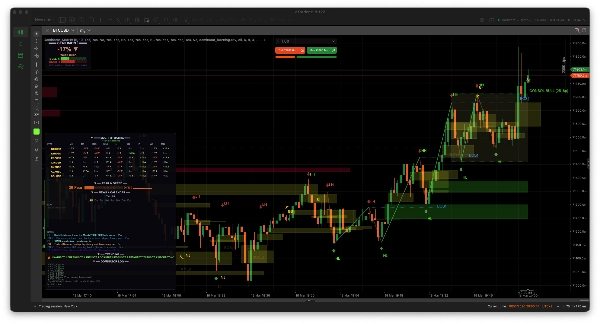
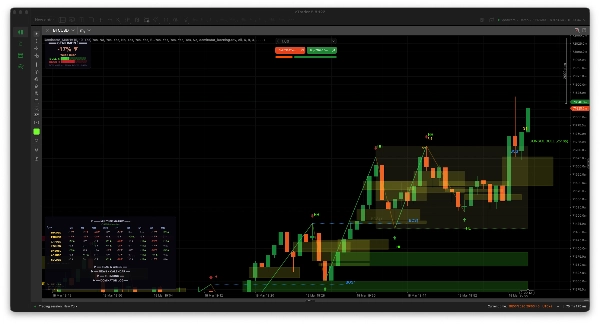
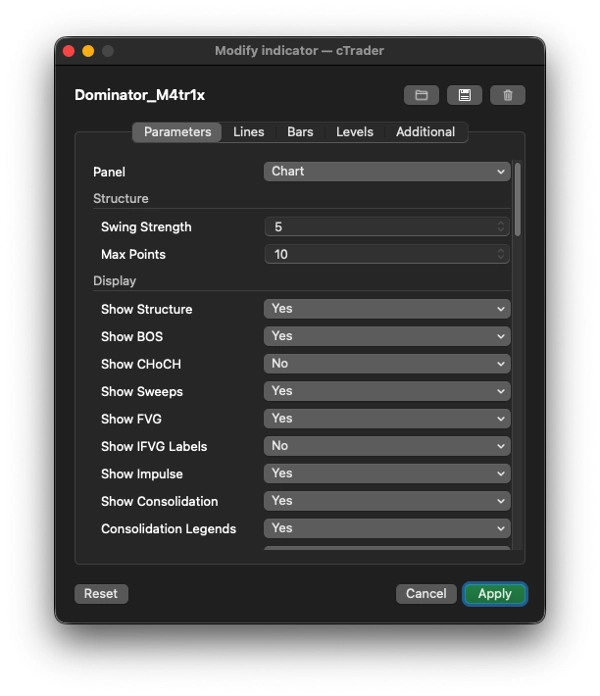
1. 📊 TRÊN BIỂU ĐỒ: Phân tích Cấu trúc Smart Money
Vẽ trực tiếp trên biểu đồ giá:
Tính năng
Nó làm gì ;
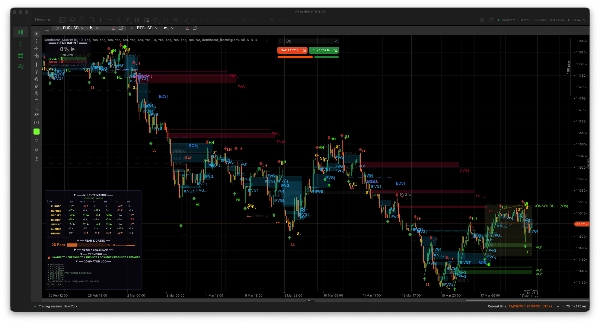
Phát hiện Swing
Xác định các đỉnh/đáy swing bằng cách sử dụng độ mạnh nhìn lại có thể cấu hình, đánh dấu chúng bằng mũi tên (▲/▼)
Nhãn Cấu trúc
Gán nhãn mỗi swing là HH (Higher High), HL (Higher Low), LH (Lower High), LL (Lower Low) để lập bản đồ cấu trúc thị trường
BOS (Phá vỡ Cấu trúc)
Vẽ các đường chấm chấm + nhãn khi giá phá vỡ đỉnh/đáy swing trước đó theo hướng xu hướng
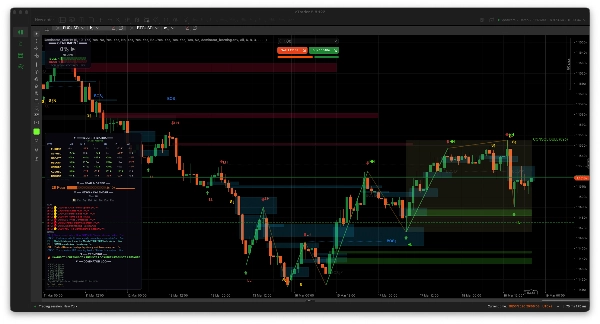
CHoCH (Thay đổi Tính cách)
Tương tự như BOS nhưng ngược lại với xu hướng — báo hiệu khả năng đảo chiều xu hướng
Vô hiệu hóa Phá vỡ
Nếu giá đảo chiều trở lại qua mức BOS/CHoCH, nó đánh dấu là thất bại (mờ đi với ✗) và ghi lại
Quét Thanh khoản
Phát hiện khi giá tạo bấc trên đỉnh swing (hoặc dưới đáy swing) nhưng đóng cửa lại bên trong — một mẫu thu hút thanh khoản cổ điển
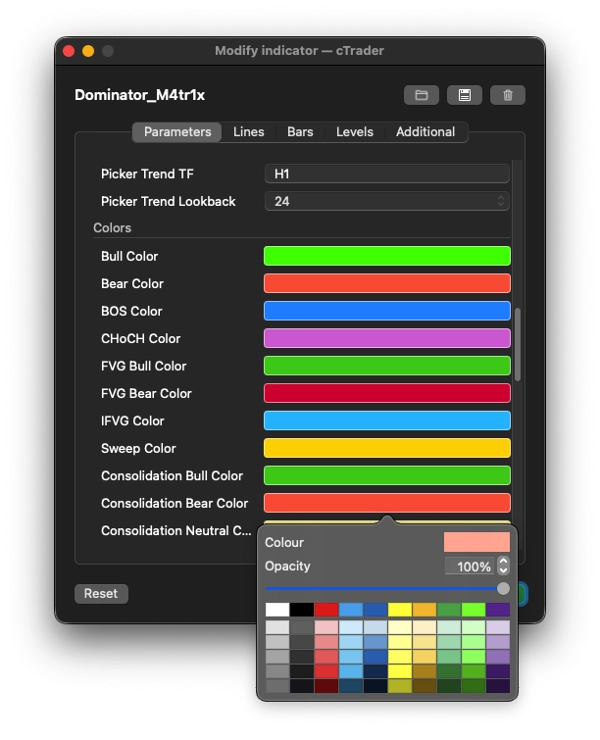
FVG (Khoảng trống Giá Trị Công bằng)
Phát hiện mất cân bằng 3 nến (khoảng trống giữa đỉnh nến 1 và đáy nến 3). Vẽ các hình chữ nhật màu trên biểu đồ
IFVG (FVG Đảo ngược)
Khi giá quay lại để lấp đầy FVG, nó gán nhãn là "IFVG" (khoảng trống trở thành vùng hỗ trợ/kháng cự tiềm năng)
Vô hiệu hóa FVG
Nếu giá đóng cửa rõ ràng qua vùng FVG, nó được đánh dấu là vô hiệu hóa
Sóng xung lực
Nối các điểm swing bằng các đường xu hướng — màu xanh lá cho chân xung lực (theo xu hướng), màu vàng cho chân điều chỉnh
Vùng Tích lũy
Phát hiện khi các đỉnh và đáy swing liên tiếp nằm trong phạm vi hẹp dựa trên ATR, vẽ một hộp với nhãn "CONSOL BULL/BEAR/NEUTRAL" hiển thị xu hướng và độ rộng pip
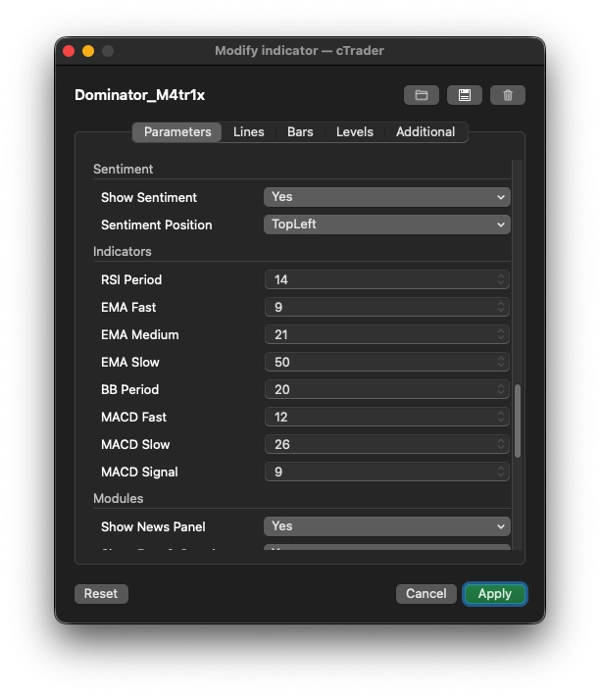
2. 📈 BẢNG TÂM LÝ (mặc định góc trên bên trái)
Một đồng hồ điểm số bò/gấu thời gian thực cho biểu tượng/khung thời gian hiện tại sử dụng:
- RSI (quá bán/quá mua + phát hiện phân kỳ)
- MACD (giao cắt, động lượng biểu đồ cột)
- 3 EMA (căn chỉnh nhanh/trung bình/chậm và vị trí giá so với chúng)
- Dải Bollinger (giá ở cực trên/dưới của dải)
Hiển thị:
- Một điểm phần trăm từ -100% đến +100% (ví dụ, "+67% BÒ MẠNH")
- Thanh điểm bò vs. gấu trực quan (█████░░░░)
- Thống kê tín hiệu đang chạy (tổng tín hiệu, xác nhận, vô hiệu hóa, tỷ lệ chính xác %)
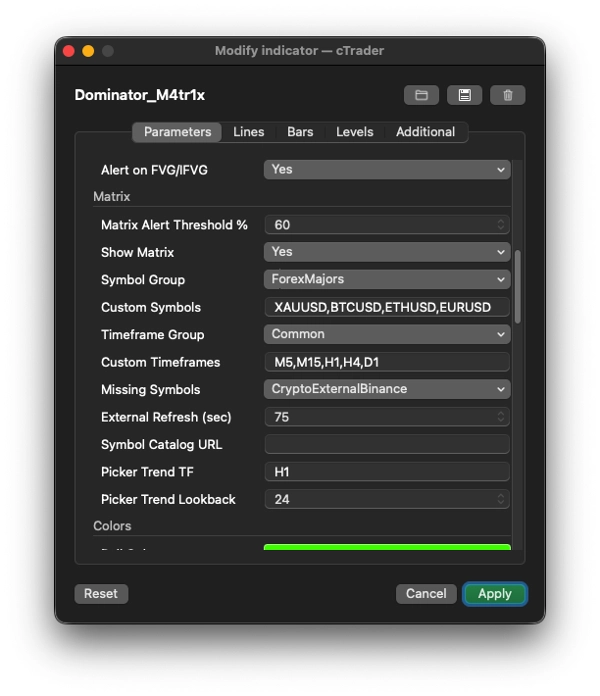
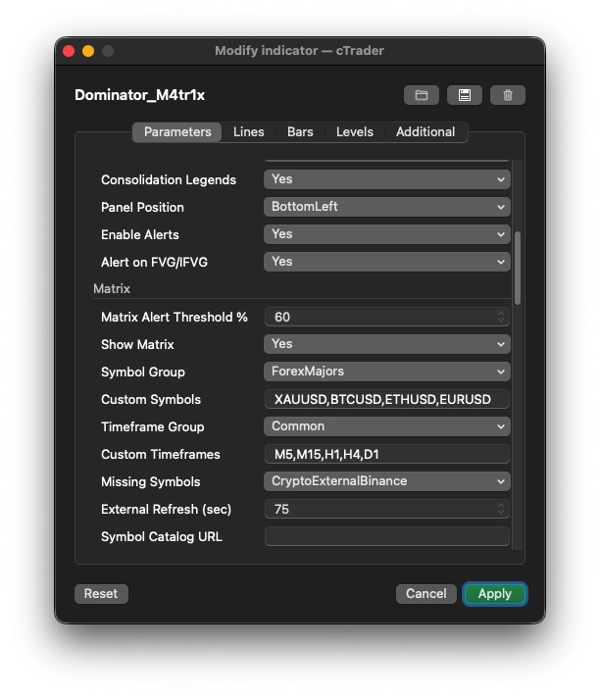
3. 🔢 MA TRẬN NHIỀU KHUNG THỜI GIAN (bảng chính)
Một lưới/bản đồ nhiệt hiển thị điểm số tâm lý bò/gấu trên nhiều biểu tượng × nhiều khung thời gian cùng lúc.
Khía cạnh
Chi tiết
Nhóm biểu tượng
Forex Majors/Minors/Exotics, Crypto, Chỉ số, Cổ phiếu Mỹ, Kim loại, Năng lượng, Hàng hóa, hoặc Tùy chỉnh
Nhóm khung thời gian
Phổ biến (M5–W1), Tất cả, hoặc Tùy chỉnh
Mỗi ô
Hiển thị điểm số mã màu như "+42▲" (xanh lá) hoặc "-67▼" (đỏ) sử dụng cùng động cơ điểm số RSI/MACD/EMA/BB
Độ phân giải biểu tượng
Rất mạnh mẽ — tự động phát hiện quy ước đặt tên của nhà môi giới (hậu tố như .r, m, .cash, dấu gạch chéo như EUR/USD), thử hàng chục biến thể bí danh, lưu kết quả
Dữ liệu bên ngoài
Đối với các biểu tượng mà nhà môi giới không cung cấp (đặc biệt là crypto), lấy dữ liệu OHLC từ Binance, Bybit, OKX, Kraken, Bitfinex API (miễn phí, không cần khóa)
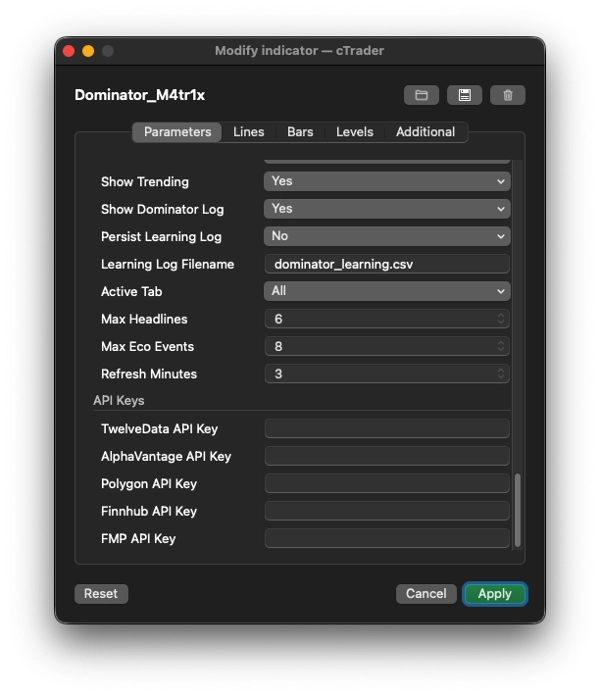
API cao cấp
Tùy chọn hỗ trợ TwelveData, AlphaVantage, Polygon, Stooq cho cổ phiếu/chỉ số/forex qua khóa API
Tương tác
Nhấp vào tên biểu tượng bất kỳ → mở bộ chọn biểu tượng có thể tìm kiếm với hơn 100 biểu tượng trên tất cả các danh mục, hiển thị thay đổi % 24h. Nhấp vào tiêu đề khung thời gian bất kỳ → mở bộ chọn khung thời gian để đổi cột
Cảnh báo
Khi bất kỳ ô nào vượt quá ngưỡng có thể cấu hình (ví dụ, ±60%), phát âm thanh cảnh báo
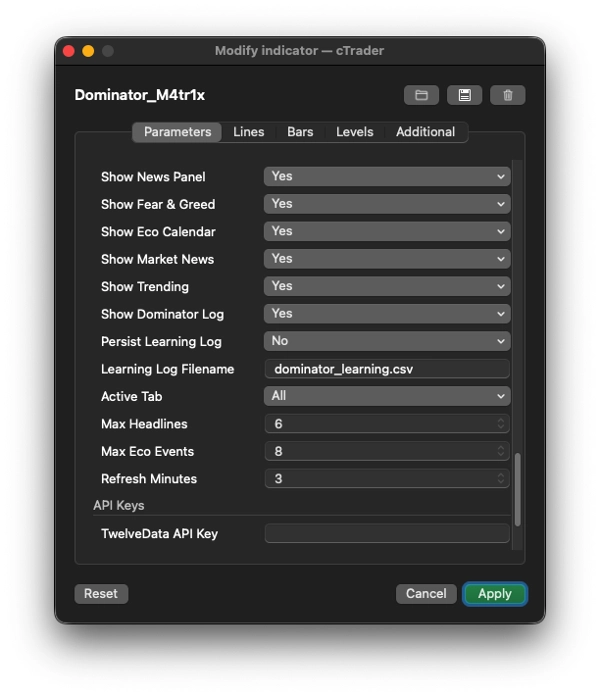
4. 📰 BẢNG TIN + THÔNG TIN
Lịch Kinh tế
Tổng hợp các sự kiện kinh tế có tác động cao/trung bình sắp tới từ 8+ nguồn dư thừa:
- ForexFactory (JSON + XML), TradingView, Finnhub, TradingEconomics, MQL5, FXStreet, FMP (FinancialModelingPrep)
- Mã màu theo mức độ khẩn cấp (đỏ = NGAY, cam = <15 phút, vàng = <1 giờ, xanh lá = sau đó)
Tiêu đề Tin tức Thị trường
Tổng hợp từ 12+ nguồn RSS/API:
- Crypto: CryptoCompare, CoinDesk, CoinTelegraph, NewsBTC, thông báo Binance, trạng thái hệ thống OKX
- Forex: FXStreet, ForexLive
- Chỉ số/Cổ phiếu: MarketWatch, CNBC, Reuters, Yahoo Finance
- Tự động phân loại tiêu đề (crypto/forex/kim loại/năng lượng/cổ phiếu) bằng phát hiện từ khóa
- Có thể lọc theo tab (Tất cả, Forex, Crypto, Kim loại, Chỉ số, Cổ phiếu, Năng lượng, Kinh tế)
Chỉ số Sợ hãi & Tham lam
- Lấy Chỉ số Sợ hãi & Tham lam Crypto (API alternative.me, với dự phòng CNN Business)
- Hiển thị giá trị số (0–100), nhãn (Sợ hãi Cực độ → Tham lam Cực độ), thanh màu, và lịch sử đường tia 7 ngày (▁▂▃▄▅▆▇█)
Xu hướng
- Lấy các đồng crypto di chuyển hàng đầu từ bảng giá 24h Binance (5 đồng tăng mạnh nhất + 5 đồng giảm mạnh nhất)
- Dự phòng bằng xu hướng CoinGecko hoặc CoinPaprika
5. 📝 NHẬT KÝ DOMINATOR + HỆ THỐNG HỌC TẬP
- Giữ nhật ký tín hiệu hiển thị 8 tín hiệu cuối cùng với trạng thái (● đang hoạt động, ✓ đã xác nhận, ✗ đã vô hiệu hóa)
- Theo dõi tổng thể thống kê độ chính xác (tổng tín hiệu, xác nhận khớp lệnh, vô hiệu hóa, tỷ lệ chính xác %)
- Lưu trữ CSV tùy chọn: ghi lại mọi sự kiện tín hiệu (mới/xác nhận/vô hiệu) vào file CSV (
dominator_learning.csv) với đầy đủ siêu dữ liệu — thiết kế để phục vụ cho học máy hoặc kiểm thử lại trong tương lai
6. 🛠 Điểm nổi bật Kiến trúc Kỹ thuật
- Hoàn toàn phủ lên (
IsOverlay = true) — vẽ trên biểu đồ giá, không phải bảng điều khiển riêng biệt - AccessRights = None — chạy trong sandbox của nhà môi giới (không truy cập hệ thống file / mạng ngoài những gì cAlgo cho phép)
- Lấy dữ liệu bất đồng bộ — tất cả các cuộc gọi HTTP chạy trên các luồng nền qua
Task.Run()để không bao giờ chặn biểu đồ - Bộ nhớ đệm thông minh — độ phân giải biểu tượng, dữ liệu OHLC bên ngoài, giá ticker, và phần trăm xu hướng đều được lưu trữ với khoảng thời gian làm mới có thể cấu hình
- Tự động thử lại — các lần thử độ phân giải biểu tượng và lấy dữ liệu bên ngoài thất bại sẽ thử lại mỗi 45 giây
- Các phần có thể thu gọn — mỗi phần bảng điều khiển (Matrix, Fear & Greed, Tin tức, Xu hướng, Nhật ký) có thể được thu gọn/mở rộng bằng cách nhấp vào tiêu đề
Tóm lại
Dominator M4tr1x là một chỉ báo Thông tin thay thế toàn bộ bảng điều khiển giao dịch. Nó lập bản đồ cấu trúc smart-money trên biểu đồ (BOS, CHoCH, FVGs, quét, tích lũy), chấm điểm tâm lý đa tài sản/đa khung thời gian qua các chỉ báo kỹ thuật, tổng hợp lịch kinh tế và tin tức thị trường từ hơn 20 nguồn, theo dõi Chỉ số Sợ hãi & Tham lam, hiển thị tài sản xu hướng, ghi lại tất cả tín hiệu của chính nó với theo dõi độ chính xác, và cho phép bạn tương tác đổi biểu tượng và khung thời gian — tất cả trong khi lấy dữ liệu thiếu từ hơn 5 API sàn giao dịch bên ngoài ở nền.
5 | 0 % | |
4 | 100 % | |
3 | 0 % | |
2 | 0 % | |
1 | 0 % |


![Logo "[Stellar Strategies] MARSI Signal Plotter"](https://cdn.ctrader.com/image/webp/7b2b8da6-8f8e-4646-8d4a-4710c516c01e_25567)


