
Phân tích của PrometheusSMC
PrometheusSMC đọc cấu trúc giá, khối lượng và biến động trên nhiều khung thời gian để xác định nơi hoạt động của tổ chức có khả năng ảnh hưởng đến giá nhất. Nó xử lý sáu lớp dữ liệu trên mỗi thanh:
- Cấu trúc thị trường — đỉnh/đáy dao động (bị trì hoãn bởi các thanh StructureStrength để xác nhận), BOS (tiếp tục xu hướng), và CHoCH (đảo chiều)
- Khối lệnh — vùng nơi các lệnh tổ chức có khả năng tích lũy, được lọc bởi khối lượng vượt ngưỡng OB Volume Threshold chuẩn độ lệch trên trung bình
- Fair Value Gaps — mất cân bằng giá 3 nến với theo dõi việc lấp đầy; các vùng bị loại bỏ khi giá giao dịch qua thân khoảng trống (không chỉ cạnh)
- Quét thanh khoản — phát hiện khi giá vượt qua điểm dao động trước đó rồi đảo chiều, mẫu săn dừng cổ điển
- Chế độ xu hướng — giao cắt EMA kết hợp với bộ lọc biến động ADX và độ rộng Bollinger Band để phân loại thị trường là xu hướng, đi ngang hoặc dao động
- Ngữ cảnh phiên — xác định giờ vùng chết (07:00 và 11:00 UTC) nơi tín hiệu bị làm mờ để giảm nhiễu
Cách Diễn giải Tín hiệu và Các Yếu tố Hình ảnh
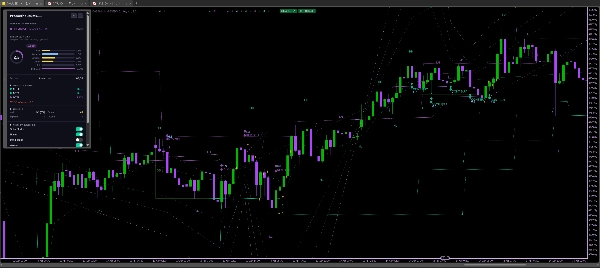
Mũi tên và nhãn:
- Mũi tên REV BUY / REV SELL đánh dấu CHoCH (Thay đổi Tính cách) — dấu hiệu đầu tiên cho thấy xu hướng có thể đảo chiều
- Mũi tên CONT BUY / CONT SELL đánh dấu BOS (Phá vỡ Cấu trúc) — tiếp tục xu hướng
- Màu mũi tên phản ánh cấp độ chất lượng thiết lập: xanh lơ = CAO, xanh lá = TỐT, tím = TRUNG BÌNH, xanh da trời = TRUNG BÌNH, vàng = YẾU, xám = KÉM
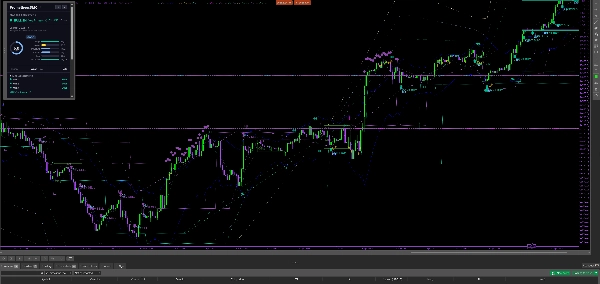
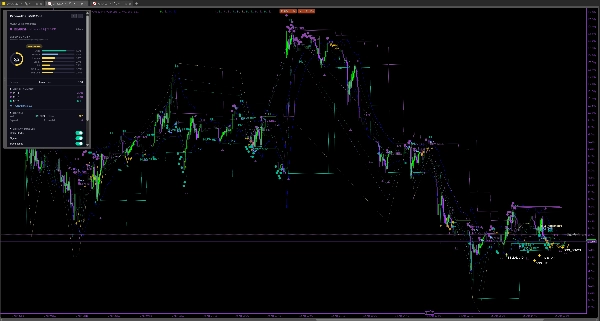
Vùng màu:
- Hình chữ nhật xanh lá/tím đánh dấu khối lệnh tăng/giảm; vùng mờ đi khi đã được giảm thiểu
- Đường chấm teal/tím đánh dấu Fair Value Gaps chưa được lấp đầy; chúng biến mất khi giá giao dịch qua khoảng trống
- Đường neo tím/xanh lơ kéo dài từ các điểm CHoCH cho thấy nguồn gốc của sự đảo chiều
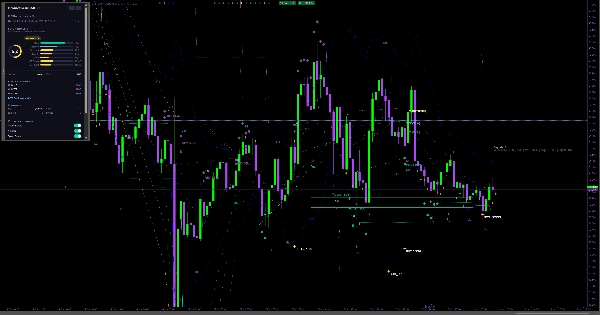
Mức TP/SL:
- TP1 và TP2 sử dụng hệ số cố định từ điểm vào (mặc định 1.5× và 2.5× rủi ro)
- TP3 nhắm vào vùng thanh khoản đối diện (điểm dao động hoặc khối lệnh gần nhất trên/dưới điểm vào) — mục tiêu cấu trúc cho bước di chuyển lớn
- SL được đặt tại cực khối lệnh với bộ đệm hệ số có thể cấu hình
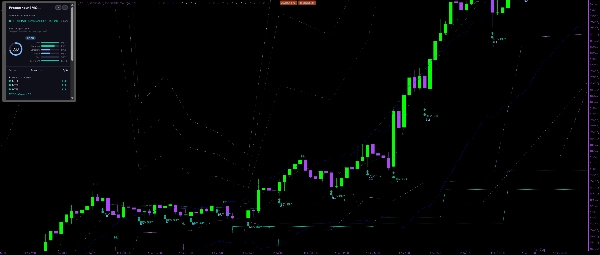
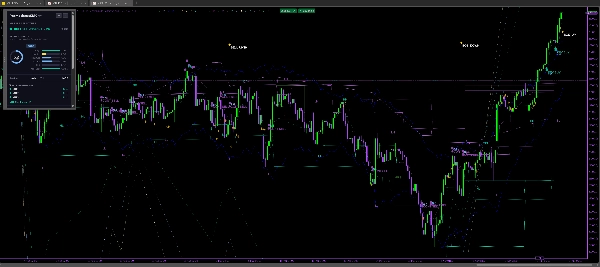
Bảng điều khiển hiển thị xu hướng hiện tại, điểm số thiết lập đang hoạt động, sự đồng bộ MTF trên ba khung thời gian, trạng thái phiên, sự hiện diện của quét và FVG, và kích thước vị trí được tính toán dựa trên % rủi ro tài khoản của bạn.
Cài đặt và Tham số Chính
Structure Strength (mặc định: 4) — Số thanh để xác nhận điểm dao động. Cao hơn = ít nhưng các phá vỡ cấu trúc quan trọng hơn.
Lookback Period (mặc định: 12) — Số thanh để tính trung bình khối lượng và quét OB.
OB Volume Threshold (mặc định: 1.8σ) — Khối lượng phải vượt trung bình bao nhiêu để xác thực một khối lệnh.
Minimum Score for Signal (mặc định: 6, phạm vi: 0-10) — Cổng chất lượng. Tín hiệu chỉ xuất hiện khi điểm tổng hợp đạt ngưỡng này.
Sweep Bonus Weight (mặc định: 1.0) — Mức độ quét thanh khoản trước CHoCH tăng điểm thiết lập.
FVG Bonus Weight (mặc định: 0.5) — Mức độ gần với FVG chưa lấp đầy tăng điểm thiết lập.
Sweep Lookback Bars (mặc định: 0 / tự động) — Khoảng cách nhìn lại để tìm điểm dao động khi kiểm tra quét. Tự động = Structure Strength × 4. Tăng lên 100-200 trên khung thời gian thấp hơn để bắt các quét cấp độ hàng ngày.
Enable Structure-Based TP (mặc định: bật) — Khi bật, TP3 nhắm vào điểm dao động hoặc khối lệnh đối diện thay vì hệ số cố định.
MTF1 / MTF2 / MTF3 Timeframes (mặc định: 60 / 240 / 1440 phút) — Ba khung thời gian cao hơn để chấm điểm đồng bộ.
Risk Per Trade % (mặc định: 1.0%) — Dùng để tính kích thước vị trí trên bảng điều khiển.
Show Dashboard (mặc định: bật) — HUD trên biểu đồ với điểm số, xu hướng và đồng bộ MTF.
Use WebView Dashboard (mặc định: tắt) — Bảng điều khiển HTML mở rộng với nhiều chi tiết hơn. Yêu cầu cTrader Desktop trên Windows hoặc macOS.
Các Trường hợp Sử dụng Điển hình
Giao dịch nhanh trên 1-5 phút với ngữ cảnh cấu trúc: Đặt Structure Strength từ 2-3 để tín hiệu nhanh hơn, giảm Minimum Score for Signal xuống 5, và sử dụng MTF 60 phút để định hướng. Bản đồ nhiệt độ tin tưởng giúp bạn bỏ qua các điểm vào chất lượng thấp một cách nhanh chóng.
Giao dịch trong ngày trên 15 phút: Cài đặt mặc định hoạt động tốt. Chú ý mũi tên CHoCH với thưởng quét (xanh lơ/xanh lá) trong các phiên London hoặc New York. Chốt TP1 nhanh, để TP3 chạy đến vùng thanh khoản đối diện.
Giao dịch swing trên 1H/4H: Tăng Structure Strength lên 5-6 để bắt các phá vỡ cấu trúc quan trọng. Đặt Sweep Lookback Bars lên 200+ để bắt các quét đỉnh/đáy hàng tuần. Tăng Minimum Score for Signal lên 7-8 để có ít điểm vào hơn nhưng chất lượng cao hơn.
Bộ lọc đồng thuận: Bật đồng bộ MTF và yêu cầu ít nhất 2 trong 3 khung thời gian đồng ý với hướng tín hiệu trước khi vào lệnh.
Ai Phù hợp Nhất Với Chỉ báo Này
PrometheusSMC được xây dựng cho các nhà giao dịch đã hiểu Khái niệm Tiền Thông minh (khối lệnh, Fair Value Gaps, quét thanh khoản, cấu trúc thị trường) và muốn một hệ thống nhất quán, dựa trên quy tắc để xác định và chấm điểm các thiết lập. Nó không phải là dịch vụ tín hiệu cắm và chạy
— việc chấm điểm chất lượng yêu cầu bạn hiểu các thành phần có nghĩa gì và điều chỉnh chúng cho công cụ và khung thời gian của bạn.
Trình độ kinh nghiệm: Trung cấp đến nâng cao. Người mới có thể dùng để học SMC bằng cách quan sát cách cấu trúc, OB và FVG tương tác, nhưng nên giao dịch thử trước và nghiên cứu phân tích điểm số trước khi mạo hiểm vốn.
Phong cách giao dịch: Nhà giao dịch trong ngày và swing trên forex, chỉ số (US30, NAS100), và vàng (XAUUSD). Scalper có thể dùng với độ mạnh cấu trúc giảm. Bao gồm các cài đặt sẵn cho XAUUSD, US30, NAS100 và các cặp forex chính.
Những Hạn chế và Lưu ý Quan trọng Khi Sử dụng
- Không vẽ lại: Chuỗi đầu ra (mũi tên, nhãn, vùng) chỉ xuất hiện trên các thanh đã xác nhận. Thanh đang chạy cập nhật điểm số nội bộ một cách phản ứng, nhưng trạng thái cấu trúc (điểm dao động, hướng xu hướng, khối lệnh, FVG) chỉ được xác nhận khi đóng thanh. Điều này có nghĩa
thanh cuối cùng trên biểu đồ của bạn có thể dịch chuyển khi giá di chuyển — đây là hành vi mong đợi và đúng đắn
- Không đảm bảo lợi nhuận: PrometheusSMC xác định cấu trúc và chấm điểm sự đồng thuận; nó không dự đoán hướng đi. Bất kỳ thiết lập nào cũng có thể thất bại. Luôn sử dụng quản lý rủi ro hợp lý và không bao giờ mạo hiểm nhiều hơn khả năng chịu đựng mất mát
- Bảng điều khiển WebView yêu cầu cTrader Desktop trên Windows hoặc macOS. Nó sẽ không hiển thị trên cTrader Web hoặc Mobile. Bảng điều khiển trên biểu đồ hoạt động trên tất cả các nền tảng
- Các công cụ cài đặt sẵn (XAUUSD, US30, v.v.) điều chỉnh độ mạnh cấu trúc, chu kỳ EMA và ngưỡng OB cho từng thị trường. Nếu công cụ của bạn không có trong danh sách cài đặt sẵn, hãy bắt đầu với mặc định và điều chỉnh từ đó
- Hiệu suất lịch sử được hiển thị bởi bất kỳ kiểm thử lại hoặc phát lại biểu đồ nào không đảm bảo kết quả tương lai. Các tín hiệu trong quá khứ trên biểu đồ có thể trông tốt hơn thực tế do đặc tính chỉ xuất ra trên thanh đã xác nhận


