
VoltyBands
指标
版本 1.0, May 2026
Windows 版、Mac 版
说明
VoltyBands 是一种自适应基于波动率的指标,能够动态跟踪价格行为,并通过响应式的上下轨带可视化市场状况。与静态通道指标不同,VoltyBands 实时调整以反映波动性的变化,帮助交易者更好地理解价格的扩张和收缩阶段。
通过结合自适应带计算和可选的平滑信号线,VoltyBands 提供了一个清晰的框架,用于分析动量、识别潜在的反转区域以及发现盘整期。
主要特征
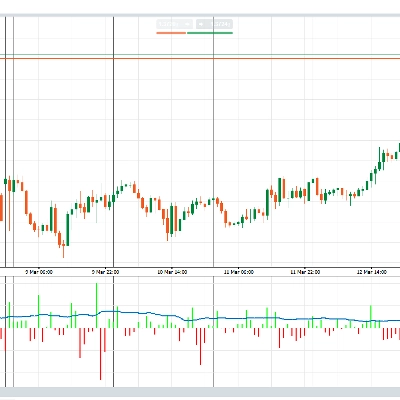
- 自适应波动率带
根据当前市场活动,带自动扩展和收缩。 - 零中心模式
可选择显示相对于中心基线的价格移动,以提高清晰度。 - 归一化选项
实现一致的缩放,便于跨不同工具和时间框架比较信号。 - 集成移动平均线
内置平滑,支持多种选择方法(SMA、EMA、SMMA、LWMA)。 - 可定制显示
可选中间线和灵活的可视化设置。
使用方法
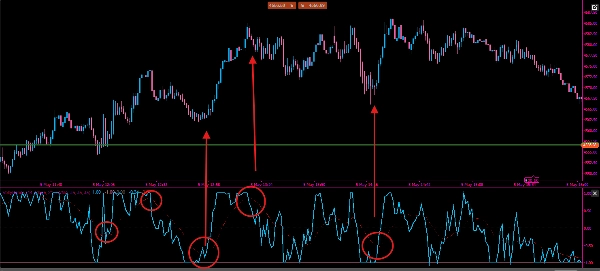
- 动量检测
价格接近上轨可能表示看涨力量,而接近下轨则暗示看跌压力。 - 反转区域
中心线的极端偏离可突出价格可能回转的区域。 - 波动率分析
带宽扩大表示波动率增加;带宽缩小表示盘整。 - 信号确认
使用移动平均线作为进出场的额外过滤器。
参数
- 长度 – 定义波动率计算的敏感度
- 来源 – 输入价格(收盘价、开盘价等)
- MA周期 – 平滑线的周期
- MA方法 – 移动平均类型(SMA、EMA、SMMA、LWMA)
- 显示中线 – 切换中心线显示
- 零绑定 – 启用基于零的可视化
- 归一化 – 激活归一化缩放
实际应用
VoltyBands 可用于实时评估动量和市场结构。当价格保持接近上轨时,表明持续的看涨压力;而持续与下轨互动则表示看跌状况。
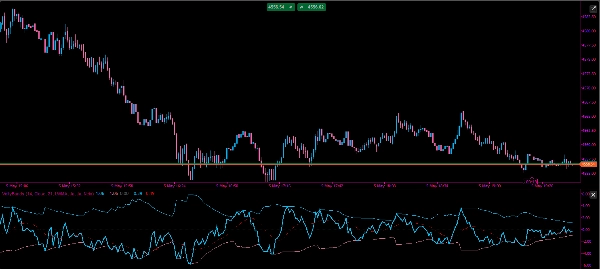
在震荡市场中,交易者可能会观察价格在轨道之间移动,利用外部水平作为均值回归的潜在区域。相反,在强趋势期间,价格可能“骑乘”轨道的一侧,表示趋势延续而非反转。
中线可以作为动态均衡水平。价格穿越该线可用作方向性信号,尤其是在结合内置移动平均线确认时。
在归一化模式下,数值可被解释为相对极值,使得无论工具或时间框架如何,都更容易识别过度延伸的情况。
与任何指标一样,VoltyBands 在结合价格行为和额外确认工具时效果最佳。
摘要
指标配置
指标分类
趋势
输出类型
可视化
信号
数据要求
仅 K 线
支持的信号
交叉
反转
趋势强度
波动性
突破水平位
客户评价
0.0
评价:0
客户评价
该产品尚无评价。已经试过了?抢先告诉其他人!
讨论
常见问答
EMA
Supertrend
SMA
Key Levels
Channel
Moving Average
cTrader Store 提供的所有产品,包括交易机器人、指标和插件,均由第三方开发者提供,仅供信息参考和技术访问之用。cTrader Store 并非经纪商,不提供投资建议、个人推荐或任何未来业绩保证。


猜您喜欢


价格
注册日期 21/02/2025
466.3M
交易量
180.83K
盈利点数
22
销售
6.87K
免费安装