


Mô tả
Nó làm gì
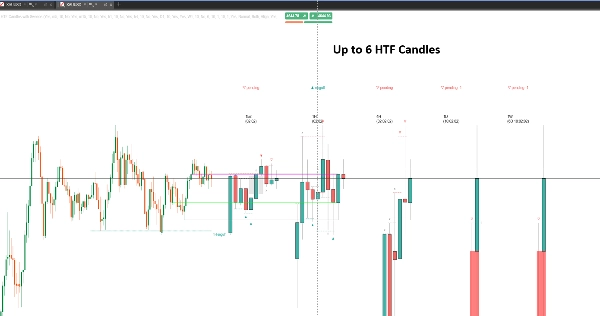
HTF Candles with Sweeps vẽ lên đến sáu khung thời gian cao hơn dưới dạng nến thực bên cạnh biểu đồ của bạn — 5m, 15m, 1H, 4H, Hàng ngày, Hàng tuần hoặc bất kỳ độ phân giải nào bạn chọn — để câu chuyện khung thời gian cao hơn nằm cạnh giá bạn đang giao dịch thay vì phải chuyển đổi biểu đồ.
Trên những cây nến đó, nó phát hiện các cú quét thanh khoản: một cây nến giao dịch vượt qua mức cao hoặc thấp phía sau nó để lấy các lệnh đang chờ ở đó. Hầu hết các công cụ chỉ dừng lại ở việc đánh dấu cú chọc. Công cụ này theo dõi những gì xảy ra tiếp theo, vì một cú quét bị thu hồi và một cú quét biến thành một đột phá mang ý nghĩa trái ngược nhau.
Bảng khung thời gian cao hơn
Sáu khe độc lập, mỗi khe có khung thời gian, số lượng nến và màu sắc riêng. Mỗi bộ vẽ với thân nến và bóng nến chính xác, đếm ngược trực tiếp đến lần đóng tiếp theo, và nhãn khung thời gian ở trên và dưới.
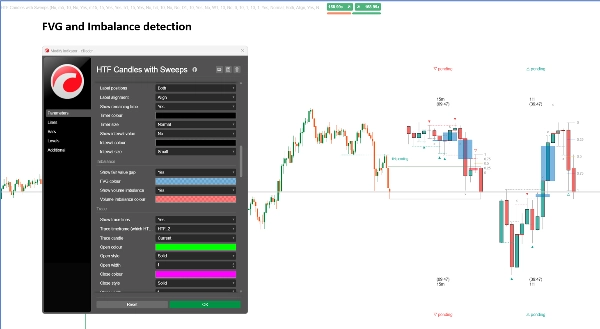
Giữa các cây nến được vẽ, bảng cũng đánh dấu khoảng trống giá trị công bằng và mất cân bằng khối lượng — những mất cân bằng tương tự mà bạn sẽ đọc trên biểu đồ khung thời gian cao hơn, mà không cần mở nó.
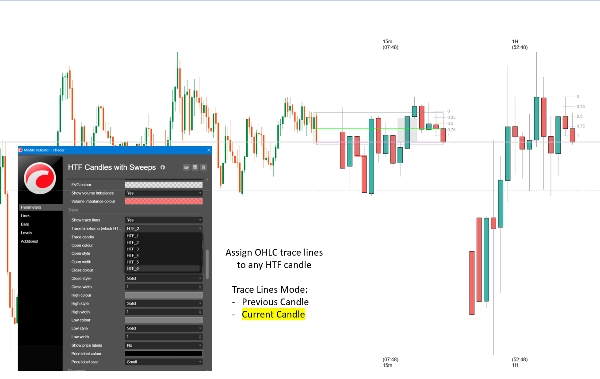
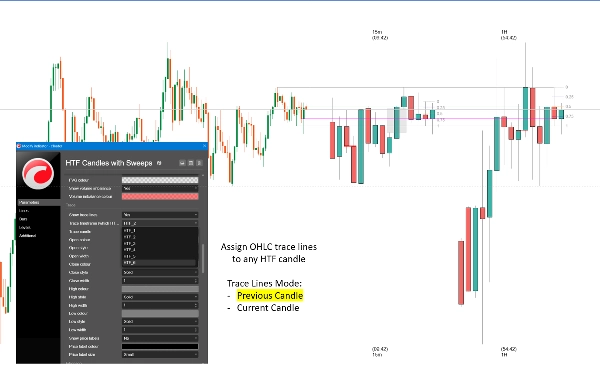
Đường vạch theo dõi kết nối giá mở cửa, cao, thấp và đóng cửa của khung thời gian được chọn trở lại thanh chính xác trên biểu đồ của bạn nơi mỗi giá được in ra, để bạn có thể thấy mức đó đến từ đâu. Chọn cây nến đang hình thành hoặc cây nến hoàn thành cuối cùng.
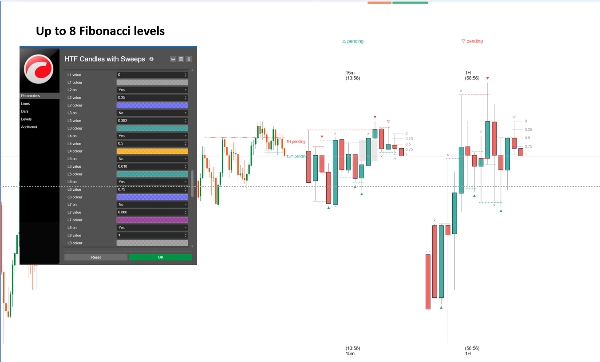
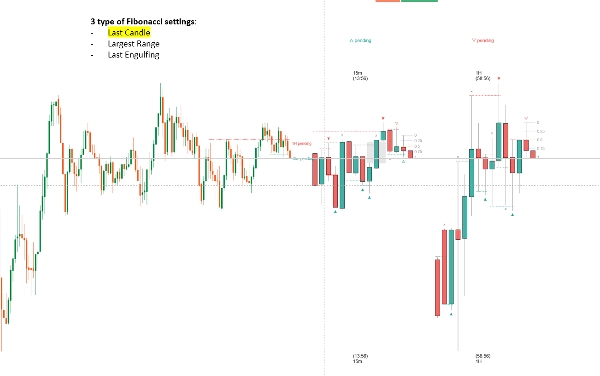
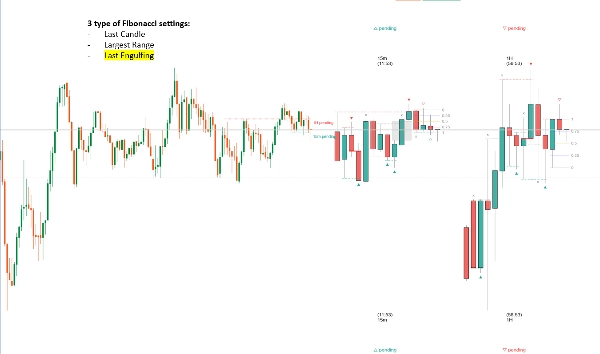
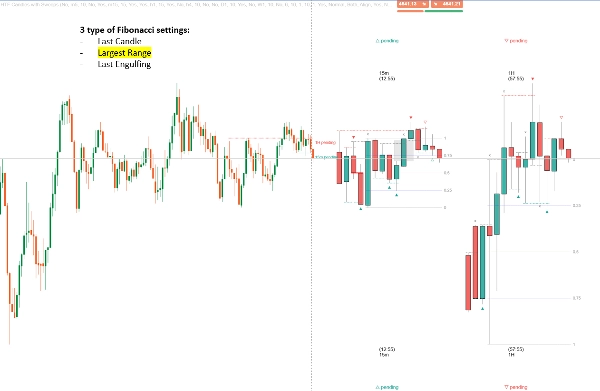
Mức Fibonacci chiếu từ một cây nến khung thời gian cao hơn với tám mức có thể cấu hình và một Mỏ Neo Thông Minh chọn cây nến cho bạn: thanh hoàn thành cuối cùng, cây nến có khoảng cách cao-thấp rộng nhất trong tầm nhìn, hoặc cây nến bao phủ gần nhất.
Phát hiện quét thanh khoản
Đối với mỗi cây nến khung thời gian cao hơn đã hoàn thành, bộ máy đi ngược lại và tìm mức cao nhất — hoặc thấp nhất — mà cây nến thực sự đã vượt qua, dừng lại ở cây nến đầu tiên mà nó không thể vượt qua. Mức đó là mức mà cú quét đã lấy.
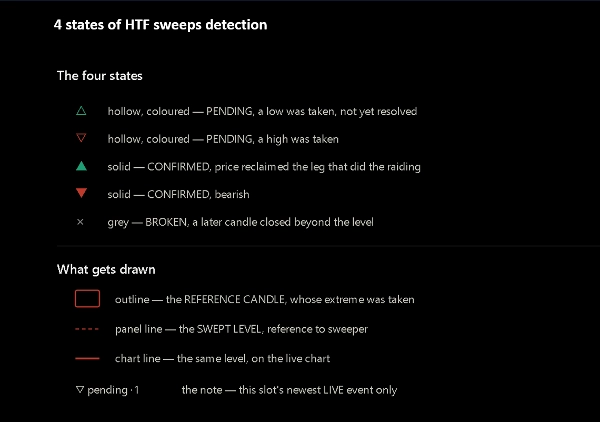
Cú quét sau đó được theo dõi qua bốn trạng thái:
— Đang chờ — mức đã bị lấy, chưa có gì giải quyết
— Xác nhận bởi CISD — giá đóng cửa trở lại qua giá mở của đợt chạy tạo ra mức cực đoan
— Xác nhận bởi bao phủ — thân cây nến sau nuốt chửng cây nến quét và đóng cửa ngược lại
— Bị phá vỡ — cây nến sau đóng cửa vượt qua mức đó, nên đó là một đột phá, không phải quét
Mỗi trạng thái mang dấu hiệu riêng, nên một cây nến đã quét luôn hiển thị điều đó, và dấu hiệu cho bạn biết kết quả cuối cùng. Không có gì bị vẽ lại: chỉ những cây nến hoàn thành mới được đánh giá, và mỗi thay đổi trạng thái được quyết định khi đóng cửa.
Sự hội tụ giữa các khung thời gian
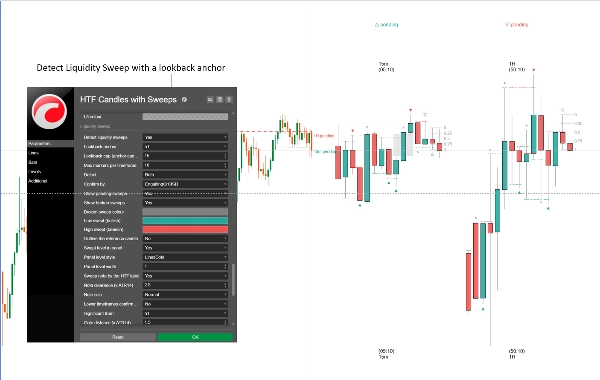
Một cửa sổ nhìn lại được biểu diễn bằng các cây nến của một khung thời gian mỏ neo và được chuyển đổi thành số lượng nến riêng của mỗi khe, nên một cú quét 15m và một cú quét hàng giờ được đo trên cùng một khoảng thời gian thị trường. Khi nhiều khung thời gian đồng thuận, chúng thực sự mô tả cùng một sự kiện.
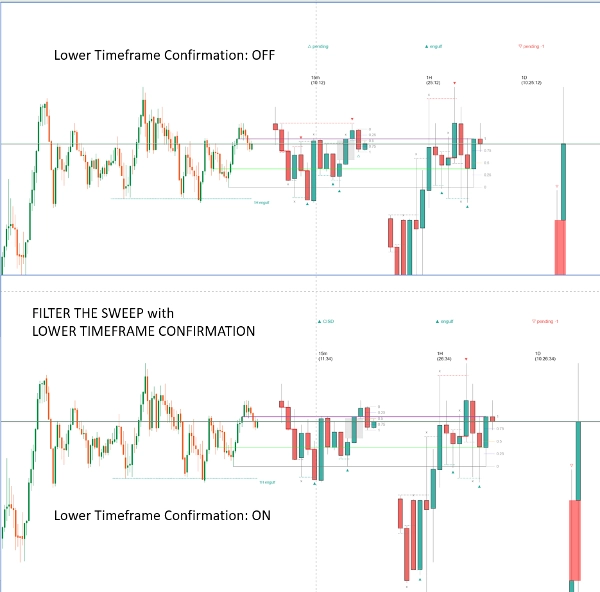
Một cổng tùy chọn nâng cao điều này: các khung thời gian thấp hơn một ngưỡng bạn chọn chỉ báo cáo một cú quét khi một khung thời gian cao hơn đã có một cú quét đang hoạt động, cùng hướng, ở mức giá tương đương. Các khung thời gian thấp hơn ngừng báo cáo nhiễu phạm vi và bắt đầu xác nhận chuyển động lớn hơn.
Các mức đã quét trên biểu đồ của bạn
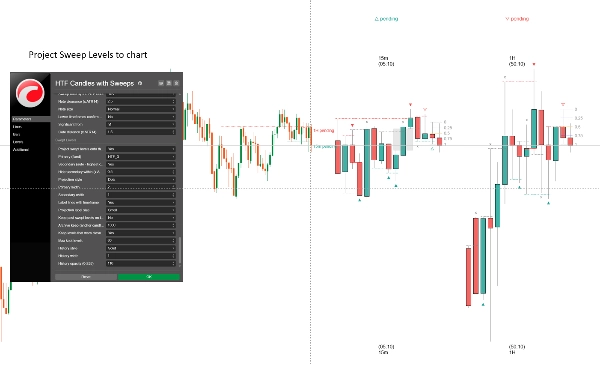
Bảng hiển thị các cây nến; biểu đồ hiển thị giá. Một mức đã quét được vẽ dưới dạng đường ngang chạy từ nơi cây nến tham chiếu thực sự hình thành, tiến tới hiện tại — được gắn nhãn với khung thời gian và trạng thái hiện tại. Một đường chính đến từ khung thời gian bạn cố định; một đường phụ tự động điền với khung thời gian cao nhất khác hiện đang được quét.
Một kho lưu trữ tùy chọn giữ các mức đã quét trước đó trên biểu đồ sau khi cây nến của chúng đã cuộn ra khỏi bảng, để bạn có thể nhìn lại cách phát hiện hoạt động trong suốt phiên.
Sử dụng điển hình
Giao dịch từ biểu đồ 5m hoặc 15m trong khi các cây nến hàng giờ và 4 giờ nằm bên cạnh. Khi một khung thời gian cao hơn quét một mức và xác nhận, bạn có hướng đi và giá để làm việc. Khi khung thời gian thấp hơn đồng thuận, bạn có sự hội tụ. Khi một mức bị phá vỡ thay vào đó, dấu hiệu cũng cho bạn biết điều đó, và bạn ngừng chờ đợi một sự đảo chiều không đến.
Nó phù hợp với giao dịch theo phong cách quét thanh khoản và tiền thông minh, công việc phá vỡ thất bại, và bất kỳ phương pháp nào xây dựng quanh các mức cao và thấp trước đó. Hữu ích trên forex, chỉ số, kim loại và tiền điện tử.
Cài đặt
— Sáu khe khung thời gian, mỗi khe có độ phân giải, số lượng nến, bật tắt fibonacci và kiểu dáng đầy đủ
— Bố cục bảng: khoảng cách từ giá, chiều rộng nến, khoảng cách giữa các nến và giữa các khung thời gian
— Nhãn: tên khung thời gian trên và dưới, bộ đếm thời gian, giá trị khoảng thời gian, kích thước và màu sắc
— Mất cân bằng: khoảng trống giá trị công bằng và mất cân bằng khối lượng, màu sắc có thể điều chỉnh
— Đường vạch theo dõi: khe nào, nến hiện tại hoặc trước đó, màu sắc từng đường, kiểu, chiều rộng và nhãn giá
— Fibonacci: tám mức với giá trị, màu sắc và bật tắt riêng, cộng ba chế độ Mỏ Neo Thông Minh
— Phát hiện quét: mỏ neo nhìn lại và giới hạn, hướng, đường xác nhận, giới hạn dấu hiệu mỗi khung thời gian
— Hiển thị dấu hiệu cho trạng thái đang chờ, đã xác nhận và bị phá vỡ
— Cổng hội tụ: khung thời gian phân chia và dung sai khoảng cách
— Chiếu biểu đồ: khe chính, khe phụ tự động, kiểu dáng và nhãn
— Kho lưu trữ: giữ lại trong các cây nến mỏ neo, số lượng tối đa giữ lại, kiểu dáng
Dành cho ai
Các nhà giao dịch trong ngày và giao dịch dao động đã làm việc với các mức cao và thấp khung thời gian cao hơn và muốn chúng hiển thị mà không phải chuyển đổi biểu đồ. Nó giả định bạn biết quét thanh khoản là gì và tại sao việc thu hồi lại quan trọng. Nếu quét chưa phải là một phần trong cách bạn đọc biểu đồ, công cụ này sẽ không dạy bạn cách giao dịch chúng.
Nó không làm gì
Rõ ràng điều này ngay bây giờ sẽ tiết kiệm thời gian cho cả hai chúng ta sau này:
— Nó không đưa ra tín hiệu mua hoặc bán, và không có giá vào lệnh, dừng lỗ hoặc mục tiêu
— Nó không đặt lệnh và không thể truy cập tài khoản của bạn — chỉ báo chạy mà không có quyền truy cập nào cả
— Nó không có cảnh báo hoặc thông báo
— Nó không dự đoán gì. Mỗi dấu hiệu mô tả các cây nến đã đóng
— Nó không vẽ lại. Chỉ các cây nến hoàn thành được đánh giá, nên dấu hiệu không bao giờ thay đổi sau đó
— Nó không phải là một chiến lược. Một cú quét đã xác nhận mô tả những gì giá đã làm, không phải bạn nên làm gì về nó
Những điều cần biết
Phát hiện đọc các cây nến mà mỗi khe thực sự vẽ, nên một cú quét luôn có một cây nến trên màn hình để đánh dấu.
Tăng số lượng nến của một khe sẽ mở rộng phạm vi nhìn lại.
Các cây nến khung thời gian cao hơn bắt đầu theo giờ máy chủ của nhà môi giới bạn. Hai nhà môi giới trên cùng một công cụ có thể cắt giờ hoặc ngày ở các điểm khác nhau, điều này có nghĩa là cùng một ký hiệu có thể đọc khác nhau hợp lệ trên hai nền tảng. Đó là đặc tính của dữ liệu, không phải lỗi của chỉ báo.
Một cú quét trên cây nến đóng gần nhất chỉ có thể đang chờ — xác nhận cần một cây nến sau đóng cửa. Trên khe hàng ngày điều đó có nghĩa là phải chờ một ngày.
Giao dịch có rủi ro. Hiệu suất trong quá khứ không đảm bảo kết quả trong tương lai.
Tóm tắt
The indicator detects liquidity sweeps—candles that trade through previous highs or lows to capture resting orders—and tracks their resolution through four states: pending, confirmed by close inside the sweep’s range, confirmed by engulfing candle, or broken (breakout). These states are visually marked and only finalized on completed candles, ensuring no repainting.
Additional features include marking fair value gaps and volume imbalances between candles, trace lines linking higher timeframe candle levels to your chart, and configurable Fibonacci levels projected from selected higher timeframe candles with smart anchoring options.
Cross-timeframe confluence is supported by aligning sweep detection across multiple timeframes, with an optional gate to filter lower timeframe sweeps that confirm higher timeframe moves. Swept levels are drawn as horizontal lines on your chart with labels indicating timeframe and state, with an optional archive to retain past levels.
Designed for intraday and swing traders familiar with liquidity sweeps and higher timeframe analysis, it supports markets including forex, indices, metals, and crypto. The indicator does not provide trade signals, alerts, or order execution and operates solely as a visual analysis tool based on completed price data.
Thảo luận
Đánh giá của khách hàng
Câu hỏi thường gặp
Sản phẩm khác của tác giả này















![Logo "Gaussian Channel [Iridio Capital]"](https://cdn.ctrader.com/image/webp/2c4f9ca9-4e9b-476d-b5a6-787c8095032b_61546)




Giá