present
Зарегистрируйтесь и получите скидку $50 на первую покупку
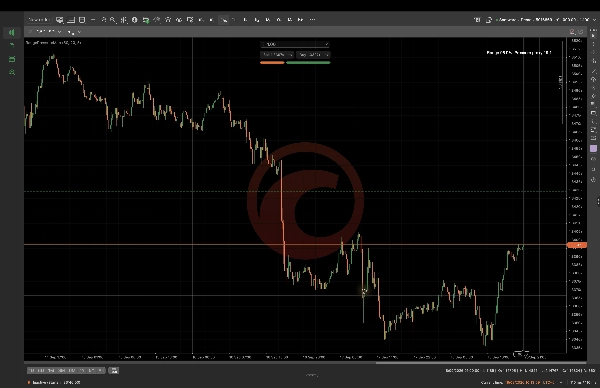
Trading product for Range Pressure Map Индикатор EMA Volume, image 1
Range Pressure Map
Индикатор
Версия 1.0, Sep 2026
Windows, Mac
5.0
Отзывы: 2
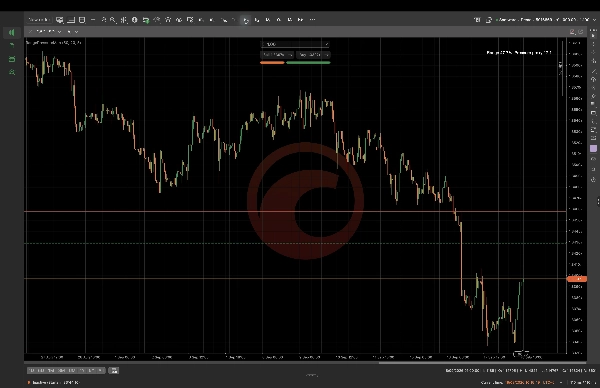
Trading product for Range Pressure Map Индикатор EMA Volume, image 2
Trading product for Range Pressure Map Индикатор EMA Volume, image 3
Trading product for Range Pressure Map Индикатор EMA Volume, image 4
Trading product for Range Pressure Map Индикатор EMA Volume, image 5
С 16/09/2026

Описание

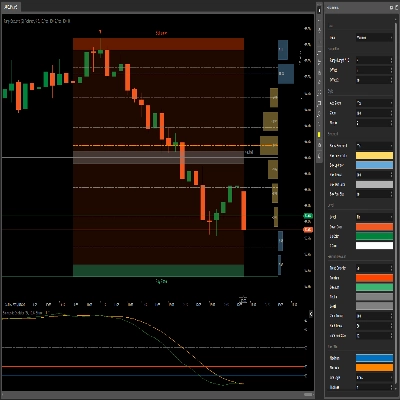
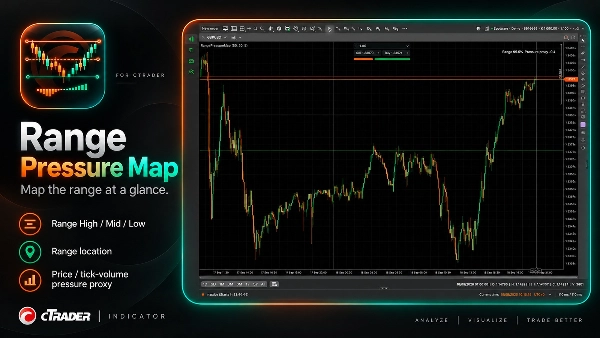
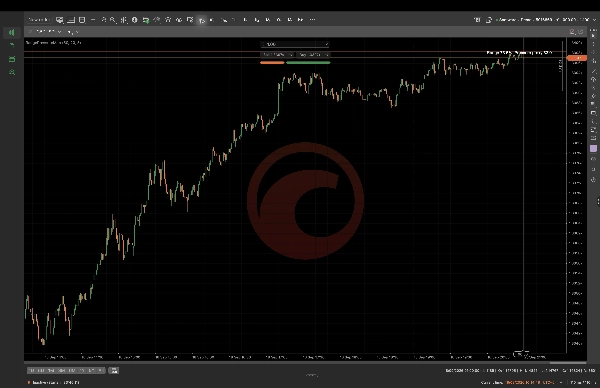
Range Pressure Map рассчитывает диапазон обратного просмотра и отображает Range High, Range Mid и Range Low вместе с текущим расположением цены и детерминированным прокси давления по объему тиков. Настройте диапазон обратного просмотра, обратный просмотр давления и длину EMA, чтобы соответствовать контексту графика, который вы просматриваете. Он предназначен для дискреционного анализа графиков и не представляет собой поток заказов, реальный рыночный объем, активность покупателей или продавцов, прогнозы или автоматическое исполнение сделок. Значения зависят от выбранного символа, таймфрейма, параметров и доступных данных.

Сводка

ИИ-сводка
Range Pressure Map is a cTrader indicator that calculates a lookback range and visually displays the Range High, Range Mid, and Range Low levels on your chart. It also shows the current price location within this range alongside a deterministic tick-volume pressure proxy, which serves as an estimate of market pressure based on tick volume data. Users can customize parameters including range lookback period, pressure lookback, and EMA length to align with their specific chart context. This tool is intended for discretionary chart analysis and does not provide order flow data, real market volume, buyer or seller activity, predictive signals, or automated trade execution. Its outputs depend on the selected trading symbol, timeframe, and input parameters. The indicator supports visualization of support and resistance levels combined with volume-based pressure insights to assist traders in analyzing price action within defined ranges.
Профиль индикатора
Категория индикатора
Поддержка и сопротивление
Тип вывода
Визуализация
Требования к данным
Только бары

Обсуждение

Отзывы покупателей

5.0
Отзывы: 2
5
100 %
4
0 %
3
0 %
2
0 %
1
0 %
Отзывы покупателей
October 20, 2026
Range Pressure Map provided a clean and consistent range view on EURUSD and XAUUSD across H1 and M1. High, Mid and Low levels were clearly plotted, while the displayed range percentage matched the visible price location well. The pressure proxy added context without cluttering the chart or being presented as true order flow. Score 4,7/5
October 7, 2026
A range high, midpoint and low put the pressure proxy in a clear setting. Lookback and EMA controls make the view adjustable, and the description is upfront about using tick volume rather than real buyer and seller flow. That honesty makes the map easier to interpret.

Частые вопросы

EMA
Volume
Продукты, доступные в cTrader Store, включая торговых ботов, индикаторы и плагины, предоставляются сторонними разработчиками и доступны исключительно в информационных и технических целях. cTrader Store не является брокером и не предоставляет инвестиционные консультации, персональные рекомендации или какие-либо гарантии будущей доходности.

Больше от этого автора

Логотип продукта "BOS CHOCH Structure"
Высокий рейтинг
4.5
(4)
$29
/
$39
Индикатор
BOS
MSS
+4
See confirmed BOS, CHOCH and SWEEP structure events on your cTrader chart.
Индикатор
BOS
Add standard-timeframe context candles to a native Renko chart.
Индикатор
Channel
Key Levels
+1
Monitor a selected chart trendline and confirm breaks on candle close.
Десктопный плагин
Trade Journal
Trade Statistics
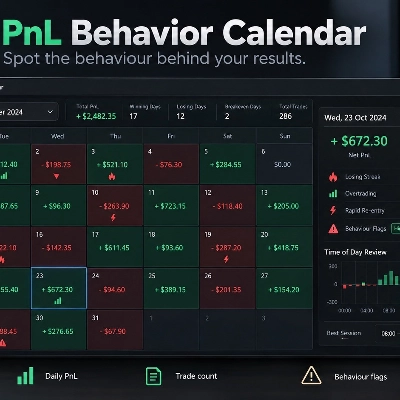
Review daily PnL, trade counts, losing streaks and rapid re-entry from your cTrader history.
Десктопный плагин
Chart UI Tools
Keep lines, zones and channels synced across selected same-symbol charts from one desktop plugin.
сиБот
Drawdown Guard
Daily Loss Limit
Monitor account-wide loss and stop-loss risk budgets, with optional order cancellation and post-fill closure.
Десктопный плагин
Position Sizer
Risk Calculator
Size manual trades from your risk settings and review Market, Limit or Stop orders before execution.
Индикатор
Volume
Key Levels
View tick activity across a selected chart range with Point of Control, Value Area High and Value Area Low.

Вам также может понравиться

Индикатор
ATR
RSI
+2
This indicator works best as a trend-confirmation tool—wait for multiple signals!
Логотип продукта "Multi VWAP"
Новинка
4.6
(3)
от $9
Индикатор
VWAP
Volume
+5
Multi VWAP. Three timeframes. One clean chart. Your Essential Trading Tool.
Индикатор
AI
ATR
+27
COT Flows. Clear Direction. 🧭
Индикатор
Grid
Prop
+5
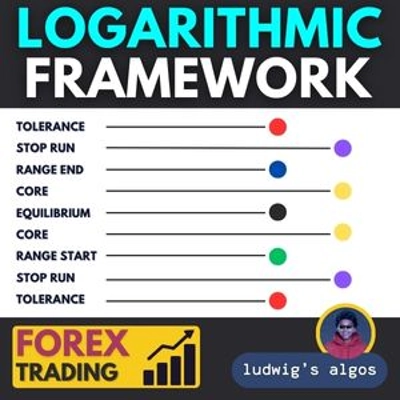
Logarithmic Framework by LudwigICT
Индикатор
RSI
SMC
+17
RSI, MACD, Stochastic, CCI & Momentum divergence scanner with confluence scoring. Never miss a signal again!
Индикатор
ATR
Prop
+4
Supertrend Indicator
Логотип продукта "Axiom Matrix"
Новинка
4.6
(3)
$39
Индикатор
Volume
Support & Resistance
Compare up to 27 symbols across eight timeframes with seven analysis engines and an interactive cTrader dashboard.
Индикатор
Forex
Indices
+1
Detects HTF bias using CRT, Expansion & Swing Point patterns with SMT/PSP divergence — visualised in a floating candle
Индикатор
BOS
CHOCH
+3
Smart Money Concepts Pro v5.1 for cTrader is a structural market analysis indicator that identifies swings, BOS, CHoC
Индикатор
Volume
Order Block
+3
Map market structure, order blocks, liquidity and key zones with an interactive cTrader dashboard.
Индикатор
ATR
BOS
+5
Market structure with BOS and CHoCH, order blocks, and retest buy/sell arrows with entry, stop and two targets
Индикатор
AI
ATR
+19
Market Cipher A
Индикатор
Volume
Key Levels
View tick activity across a selected chart range with Point of Control, Value Area High and Value Area Low.
Индикатор
Grid
Prop
+5
This technical analysis indicator provides information on market sentiment, trend and price levels....
Индикатор
Forex
Crypto
+5
🚀 Automated Elliott Wave & Fibonacci tool for cTrader. Spot trends, corrections & retracements fast.
Индикатор
Prop
Institution-level trend Analyzer.
Индикатор
BOS
CHOCH
+3
Identifies HH, HL, LH, and LL swing points using fractals. Essential for Smart Money Concepts and price action.
Индикатор
Signal
Trades Opening Range Breakouts Indicator with dynamic stops/targets adapting to market volatility.

Цена

С 16/09/2026