Descrizione
DayFlow Tick Volume Profile
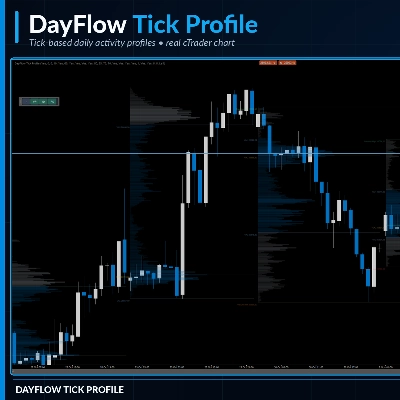
Discover where market activity is concentrated — with detailed, tick-based daily profiles directly on your cTrader chart.
DayFlow Tick Profile is a professional market activity indicator designed to help traders analyse daily price distribution, identify important activity zones and monitor key session levels.
Unlike conventional profiles that estimate activity using larger candlestick intervals, DayFlow processes available historical Bid-tick data to build detailed price-level activity distributions.
The result is a clear, colour-intensity-based profile that makes areas of higher and lower market activity easier to identify.
Key Features
Tick-Based Daily Profiles
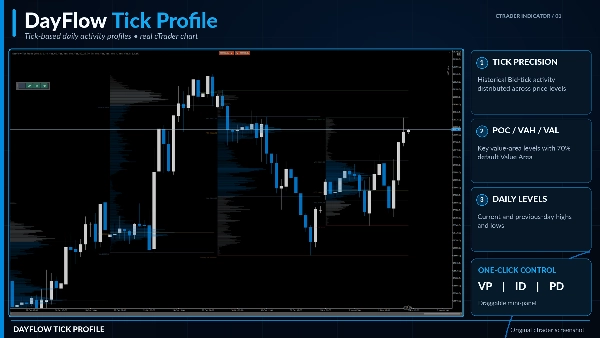
Each profile is calculated using historical Bid-price updates from your broker. With 300 price rows by default, DayFlow provides a detailed view of quote activity across the daily price range.
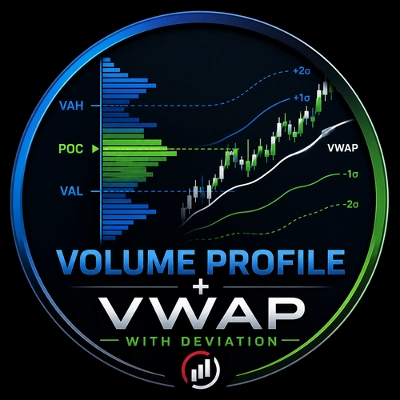
Point of Control (POC)
Automatically identifies the price level with the highest concentration of recorded tick activity.
Value Area High & Low (VAH / VAL)
Highlights the boundaries of the Value Area, calculated using a standard 70% activity threshold.
Daily High & Low Levels
Displays important reference levels directly on your chart:
- Current Day High
- Current Day Low
- Previous Day High
- Previous Day Low
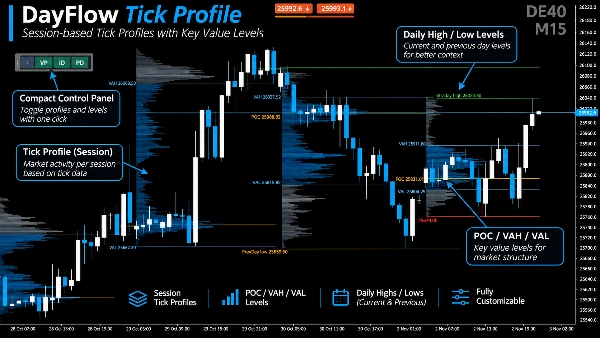
Compact On-Chart Control Panel
Quickly toggle three independent feature groups:
- VP — Volume Profile, POC, VAH and VAL
- ID — Intraday High and Low
- PD — Previous Day High and Low
The panel is draggable and collapsible, allowing you to keep your workspace clean.
Historical Session Analysis
Displays up to 10 daily profiles by default, including the current session when enabled. Historical completed profiles are cached during the indicator session for improved performance.
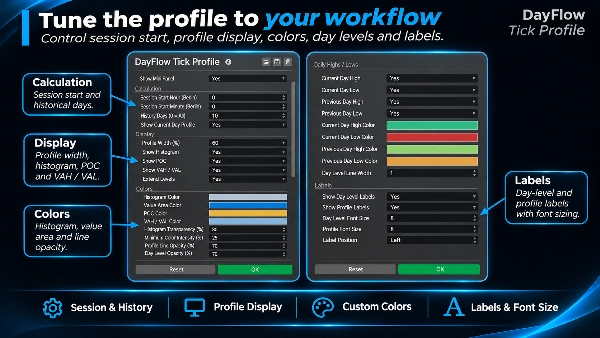
Customizable Appearance
Adjust profile width, colour intensity, transparency, level colours, line appearance, label position and font sizes.
Configurable Trading Day
Set a custom daily session start using Berlin time, making it easier to align the profiles with your preferred trading schedule.
Trading Applications
DayFlow is designed for discretionary traders who want to:
- Identify areas of concentrated or limited price-update activity
- Observe the relationship between current price and the daily POC
- Analyse price behaviour around VAH and VAL
- Monitor current and previous day highs and lows
- Add market context to intraday and price-action trading strategies
Markets & Timeframes
Suitable for analysing broker-provided tick data across supported markets, including indices, forex and cryptocurrencies.
Designed for intraday chart analysis, including M1, M5, M15, M30 and H1. Data availability and calculation results depend on the connected broker.
Platform Compatibility: cTrader Windows and Mac.
Important Information
DayFlow measures the distribution of broker-provided Bid-price updates (tick activity). It does not measure actual exchange-traded contract volume.
Profiles and key levels are analytical references, not automatic buy or sell signals. The indicator does not execute trades.
Trading involves risk. Past performance does not guarantee future results.
Riepilogo
Designed for intraday analysis on timeframes from 1 minute to 1 hour, DayFlow supports markets including indices, forex, and cryptocurrencies, depending on broker tick data availability. Users can view up to 10 historical daily profiles, with profiles cached for performance. A compact, draggable control panel allows toggling of volume profile elements, intraday highs/lows, and previous day levels. Appearance settings such as profile width, color intensity, transparency, and label fonts are customizable. The trading day start time is configurable using Berlin time to align with user preferences.
DayFlow provides analytical context for discretionary traders to identify concentrated price activity zones and monitor key session levels. It does not measure actual exchange volume nor execute trades.