present
Đăng ký và nhận ưu đãi $50 cho lần mua đầu tiên
Trading product for Pivot Levels Chỉ báo Fibonacci Fair Value Gap, image 1
Pivot Levels
Chỉ báo
Phiên bản 1.1, Nov 2026
Windows, Mac
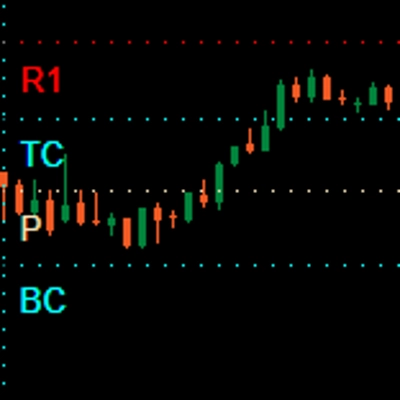
Trading product for Pivot Levels Chỉ báo Fibonacci Fair Value Gap, image 2
1
Cài đặt miễn phí

Mô tả

Pivot Levels: sessions, previous day and week, ORB, Floor Pivot and Camarilla

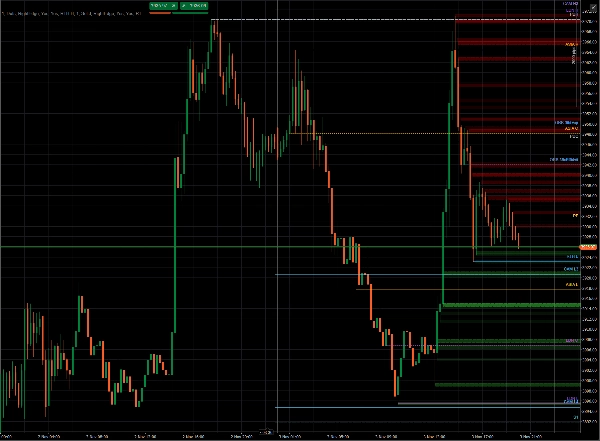
Pivot Levels puts the price levels that traders watch every day on your chart, drawn as clean rays with labels, and adds a compact table with the range of each session. It is a display-only study: it places no orders and changes nothing on your account.

What it draws

  • Today's sessions: Open, High and Low of the RTH session (09:30–16:00 New York), the Asian session (Tokyo) and the London session. Session times follow their own time zones, so daylight saving is handled for you, and you don't type any hours
  • Yesterday: Open, High, Low and Close of the previous trading day
  • Previous week: Open, High, Low and Close of the previous week.
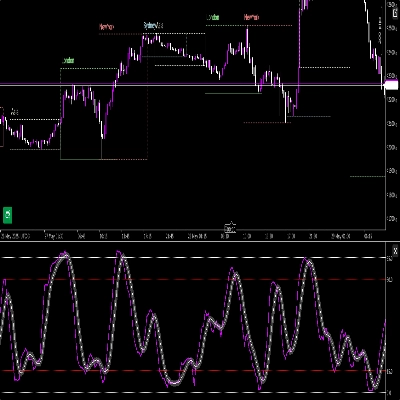
  • Opening Range Breakout (ORB): the high ("up") and low ("down") reached in the first 15 and 30 minutes of the RTH session. Draw them only once the range has formed, or in real time while it forms
  • Floor Pivot: PP, R1, R2, S1, S2, calculated from the previous trading day
  • Camarilla: H3, H4, H5, L3, L4, L5, calculated from the previous trading day

Each line starts where its value was formed (the time of the high, the low or the open), so you can see when a level was set. Current levels extend to the right as rays. Past days can optionally be shown for review.


Session Range Monitor

A small table shows, for each session of the current trading day, its range in points and pips and an arrow for the direction of the session. The live session is highlighted. You choose the corner, the offsets and the font size.


Trading day without setup

By default the trading day is taken from your broker's own Daily bars, so rollover and daylight saving are the real ones for your server and nothing needs to be configured.

Alternatively you can use a fixed 17:00 New York day, identical across brokers. You can also compute yesterday, weekly and pivot levels on the full session or on RTH only.


Customization

  • Every level has its own switch, label, line width, line style, color (with the native color picker), label side and optional price value
  • Label position: left, right (follows the last bar), or anchored to the right or left edge of the chart, next to the Y axis, even while you scroll or zoom
  • A general switch to show labels only, or labels with values, and a label font size
  • History loads in the background, so the chart stays responsive. The data timeframe is chosen automatically from your chart and can be changed


Good to know

  • Works on any symbol and chart timeframe supported by your CFD broker's data since all levels are derived from price only
  • Levels are calculated from the data your broker provides, so values can differ slightly between brokers
  • This is an analysis tool, not trading advice. Past levels do not guarantee future price behavior


Tóm tắt

Hồ sơ chỉ báo
Danh mục chỉ báo
Hỗ trợ & kháng cự
Loại đầu ra
Hình ảnh trực quan
Yêu cầu dữ liệu
Chỉ dữ liệu nến
Tín hiệu được hỗ trợ
Phá vỡ giá
Đảo chiều
Sức mạnh xu hướng
Biến động
Chạm ngưỡng
Phá ngưỡng
Khoảng giá mở phiên
Phân kỳ
Giao cắt

Thảo luận

Đánh giá của khách hàng

0.0
Đánh giá: 0
Đánh giá của khách hàng
Sản phẩm này chưa có đánh giá nào. Bạn đã dùng thử chưa? Hãy là người đầu tiên chia sẻ với mọi người!

Câu hỏi thường gặp

Fibonacci
Fair Value Gap
Key Levels
Order Block
Market Structure
Supply & Demand
Support & Resistance
Các sản phẩm có sẵn trên cTrader Store, bao gồm bot giao dịch, chỉ báo và plugin, được cung cấp bởi các nhà phát triển bên thứ ba và chỉ nhằm mục đích cung cấp thông tin và tiếp cận kỹ thuật. cTrader Store không phải là nhà môi giới và không cung cấp lời khuyên đầu tư, khuyến nghị cá nhân hay bất kỳ đảm bảo nào về hiệu suất trong tương lai.

Sản phẩm khác của tác giả này

Chỉ báo
Fibonacci
Key Levels
+5
Displays the swing level zones shared by Flex Renko Inverse on any timeframe chart. Requires Flex Renko Inverse
Chỉ báo
Pin Bar
Order Block
+5
NEVER MISS A TREND & LET TRENDS RUN with Sierra Chart's Flex Renko Inverse, rebuilt for cTrader.

Bạn cũng có thể thích

Chỉ báo
RSI
Indicator Stochastic With RSI
Chỉ báo
BOS
EMA
+5
VWAP Bands indicator with 3 standard deviation levels, buy/sell zones, and a draggable ON/OFF button to toggle the entir
Chỉ báo
RSI
Signal
+2
Dynamic circles visualize price's volatility position. Like RSI for market overextension & stretch. Quantify context.
Chỉ báo
Prop
Forex
+4
Draws pivots (P, S/R, CPR) from selected anchors like H1–Month1, with optional mid-levels (PS1, S1S2, etc.)
Chỉ báo
ATR
EMA
+2
Dense EMA rainbow + Pro tools & a tested engine — get more from your EMAs, your research base for EMA bots.
Chỉ báo
Fair Value Gap
Liquidity Grab
+2
PRO Liquidity Sweep + FVG Combo detector with custom Gold/Blue signals & alerts
Chỉ báo
Breakout
Institutional Flow Radar scans the chart for abnormal volume events and classifies them into two groups: Capital &Public
Chỉ báo
Forex
Crypto
+2
Unique Pyramid Design , Clear Price Action Trend
Chỉ báo
AI
Grid
+17
BORIS Easy Trend: Relax & scalp with 6-TF alignment. Clear BUY/SELL signals & movable UI/HUD make trading effortless.
Chỉ báo
ADX
ATR
+2
GOLD SENTINEL v1.0 - A CANDLE-COLORING INDICATOR FOR GOLD.
Chỉ báo
AI
ATR
+27
Overbought Oversold Indicator
Logo "Initial Range"
Phổ biến
5.0
(3)
$25
/
$49
Chỉ báo
ATR
Prop
+15
Initial Range – Where the open writes the script.
Chỉ báo
Volume
Order Block
+3
Map market structure, order blocks, liquidity and key zones with an interactive cTrader dashboard.
Chỉ báo
Forex
GBPUSD
+3
Support & resistance zones with measured hold rates and confidence intervals — evidence, not just lines on a chart.
Chỉ báo
Zero Lag MACD delivers ultra-responsive trend and divergence signals with minimal lag, empowering timely Forex entries.
Chỉ báo
AI
SMC
+11
Perfect Entry Price designed to help traders identify the most accurate and reliable price levels for market entries
Chỉ báo
AI
SMC
+18
ICT HTF Candles- The Ultimate Multi-Timeframe Dashboard Stop switching timeframes and losing focus.
Logo "KANDIKA HEAT MAP"
Hàng đầu
4.6
(5)
$19
Chỉ báo
Color-Based Market Pressure & Volatility Visualizer The Kandika Heatmap Indicator

Giá

1
Cài đặt miễn phí