
dark-cloud
Chỉ báo
182 lượt tải
Phiên bản 1.0, Mar 2025
Windows, Mac
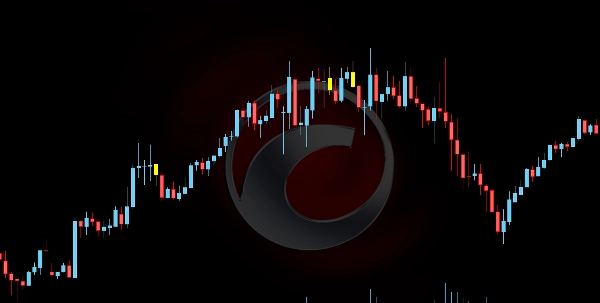
Chỉ báo Dark Cloud Cover là một công cụ phân tích kỹ thuật được thiết kế để xác định các mô hình đảo chiều giảm tiềm năng trên thị trường. Mô hình này bao gồm hai cây nến liên tiếp:
- Một cây nến tăng (màu xanh lá) báo hiệu động lực mua mạnh.
- Một cây nến giảm (màu đỏ) mở cửa cao hơn giá đóng cửa trước đó nhưng đóng cửa dưới điểm giữa của cây nến trước, cho thấy áp lực bán.
Hình thành này gợi ý sự thay đổi tiềm năng trong tâm lý thị trường, nơi người mua mất quyền kiểm soát và người bán chiếm ưu thế.
Tính năng & Chức năng:
- Phát hiện mô hình:
-
- Chỉ báo quét tìm mô hình Dark Cloud Cover dựa trên hành động giá của nến.
- Khi phát hiện, nó sẽ làm nổi bật mô hình để cảnh báo các nhà giao dịch.
- Bộ lọc xu hướng (Tùy chọn):
-
- Để cải thiện độ chính xác, chỉ báo bao gồm bộ lọc xu hướng tùy chọn sử dụng Đường Trung Bình Động (MA).
- Nếu được bật, mô hình chỉ được coi là hợp lệ khi xảy ra trong xu hướng tăng.
- Logic xác nhận:
-
- Chỉ báo có thể xác thực tín hiệu giảm bằng cách kiểm tra cây nến tiếp theo.
- Một cây nến xác nhận được nhận diện nếu nó đóng cửa dưới mức thấp của Dark Cloud Cover và có khối lượng tick cao hơn mức trung bình của các cây nến gần đây.
- Điều này đảm bảo độ tin cậy mạnh hơn của tín hiệu.
- Các dấu hiệu trực quan:
-
- Nến màu vàng: Đánh dấu mô hình Dark Cloud Cover được phát hiện.
- Nến màu cam: Làm nổi bật cây nến xác nhận nếu các điều kiện về khối lượng được đáp ứng.
Chỉ báo này giúp các nhà giao dịch phát hiện các thiết lập đảo chiều có xác suất cao, cải thiện việc ra quyết định cho các lệnh bán khống hoặc các chiến lược quản lý rủi ro.
Hồ sơ chỉ báo
0.0
Đánh giá: 0
Đánh giá của khách hàng
Sản phẩm này chưa có đánh giá nào. Bạn đã dùng thử chưa? Hãy là người đầu tiên chia sẻ với mọi người!
Signal
Các sản phẩm có sẵn trên cTrader Store, bao gồm bot giao dịch, chỉ báo và plugin, được cung cấp bởi các nhà phát triển bên thứ ba và chỉ nhằm mục đích cung cấp thông tin và tiếp cận kỹ thuật. cTrader Store không phải là nhà môi giới và không cung cấp lời khuyên đầu tư, khuyến nghị cá nhân hay bất kỳ đảm bảo nào về hiệu suất trong tương lai.
Sản phẩm khác của tác giả này


5
Lượt bán
429
Cài đặt miễn phí