Mô tả
📌 Tính năng & Chức năng
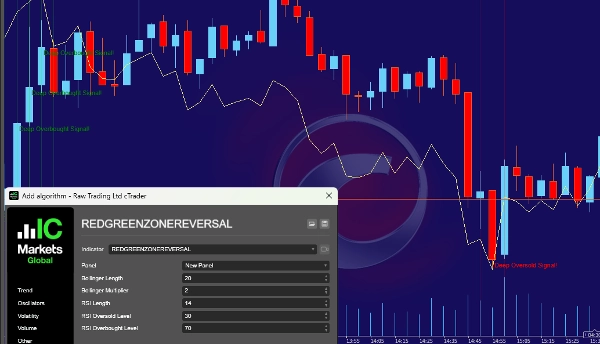
- Dải Bollinger (SMA 20 kỳ với độ lệch chuẩn 2)
-
- Dải trên: Chỉ mức mua quá mức.
- Dải dưới: Chỉ mức bán quá mức.
- Chỉ số sức mạnh tương đối (RSI) (14 kỳ)
-
- RSI trên 70 → Thị trường mua quá mức (áp lực mua quá mức).
- RSI dưới 30 → Thị trường bán quá mức (áp lực bán quá mức).
- Phát hiện vùng đảo chiều:
-
- Vùng đỏ (Bán quá mức):
-
- Giá đóng cửa nằm dưới dải Bollinger dưới.
- RSI dưới 30 (áp lực bán mạnh).
- Ý nghĩa: Thị trường đang bán quá mức, cơ hội mua tiềm năng.
- Vùng xanh (Mua quá mức):
-
- Giá đóng cửa nằm trên dải Bollinger trên.
- RSI trên 70 (áp lực mua mạnh).
- Ý nghĩa: Thị trường đang mua quá mức, cơ hội bán tiềm năng.
- Các dấu hiệu trên biểu đồ trực quan:
-
- Vùng tô màu đỏ khi bán quá mức (cơ hội mua tiềm năng).
- Vùng tô màu xanh khi mua quá mức (cơ hội bán tiềm năng).
- Cảnh báo & Tín hiệu âm thanh:
-
- Văn bản xuất hiện trên biểu đồ (“Tín hiệu bán quá mức sâu!” hoặc “Tín hiệu mua quá mức sâu!”).
- Thông báo âm thanh phát ra khi phát hiện điều kiện mua/bán quá mức.
🎯 Chỉ báo này giúp các nhà giao dịch như thế nào?
✅ Cung cấp tín hiệu cảnh báo cho các khả năng đảo chiều thị trường (ở các mức giá cực đoan).
✅ Giúp nhà giao dịch tìm điểm vào và ra mạnh mẽ.
✅ Kết hợp Dải Bollinger và RSI để phát hiện mua/bán quá mức đáng tin cậy.
✅ Phù hợp cho giao dịch trong ngày, giao dịch lướt sóng và giao dịch nhanh trên các khung thời gian khác nhau.
🚀 Tóm tắt:
Chỉ báo này giúp xác định các điều kiện mua quá mức và bán quá mức và cảnh báo khi có khả năng đảo chiều giá. Nhà giao dịch có thể sử dụng điều này để đưa ra quyết định mua và bán thông minh!
🚨 Tuyên bố từ chối rủi ro giao dịch 🚨
Giao dịch các công cụ tài chính, bao gồm cổ phiếu, forex, tiền điện tử, hàng hóa và phái sinh, có mức độ rủi ro cao và không phù hợp với tất cả nhà đầu tư. Trước khi tham gia bất kỳ hình thức giao dịch nào, điều quan trọng là phải hiểu rõ các rủi ro liên quan và cân nhắc kỹ lưỡng tình hình tài chính, kinh nghiệm và khả năng chịu rủi ro của bạn.
Thị trường có thể rất biến động, và các biến động giá có thể xảy ra đột ngột và khó lường do các dữ liệu kinh tế, sự kiện địa chính trị, tâm lý thị trường hoặc tin tức bất ngờ. Sự biến động này có thể mang lại lợi nhuận lớn, nhưng cũng có thể gây thua lỗ đáng kể. Thị trường có thể đi ngược lại vị thế của bạn nhanh chóng, các chiến lược dừng lỗ và quản lý rủi ro không đảm bảo ngăn chặn thua lỗ, và đòn bẩy có thể khuếch đại cả lợi nhuận và thua lỗ, có thể vượt quá số vốn đầu tư ban đầu của bạn.
Không có gì đảm bảo rằng bất kỳ chiến lược giao dịch, chỉ báo kỹ thuật hoặc phương pháp nào sẽ mang lại lợi nhuận. Hiệu suất lịch sử không đảm bảo kết quả tương lai, và thành công trong quá khứ không đảm bảo lợi nhuận trong tương lai. Ngay cả các nhà giao dịch chuyên nghiệp cũng gặp thua lỗ, điều kiện thị trường luôn thay đổi, và việc dự đoán chính xác các biến động tương lai là không thể. Giao dịch không bao giờ nên chỉ dựa trên suy đoán hoặc cảm xúc.
Việc sử dụng đòn bẩy hoặc giao dịch ký quỹ cho phép bạn kiểm soát các vị thế lớn hơn với số vốn nhỏ hơn, nhưng điều này cũng làm tăng đáng kể rủi ro. Đòn bẩy có thể dẫn đến mất vốn nhanh chóng, các yêu cầu ký quỹ có thể buộc thanh lý vị thế với giá không thuận lợi, và giao dịch ký quỹ có thể khiến bạn mất nhiều tiền hơn số tiền đã gửi ban đầu. Ngoài ra, rủi ro thanh khoản và trượt giá có thể xảy ra, có nghĩa là có thể không có đủ người mua hoặc người bán tại một thời điểm nhất định, và các lệnh có thể không được thực hiện với giá mong đợi. Các khoảng trống thị trường có thể dẫn đến sự nhảy giá đột ngột, bỏ qua hoàn toàn các mức dừng lỗ.
Giao dịch đòi hỏi kỷ luật, kiên nhẫn và kiểm soát cảm xúc. Sợ hãi, tham lam và tự tin quá mức thường dẫn đến các quyết định giao dịch kém, làm tăng khả năng thua lỗ. Giao dịch theo cảm xúc có thể dẫn đến các quyết định bốc đồng và phi lý, trong khi sợ bỏ lỡ (FOMO) và giao dịch trả thù có thể dẫn đến việc chấp nhận rủi ro quá mức. Việc phát triển một chiến lược rõ ràng và tuân thủ kế hoạch quản lý rủi ro là rất quan trọng.
Cũng cần xem xét các rủi ro pháp lý và quy định, vì các khu vực pháp lý khác nhau có các quy định khác nhau về giao dịch và đầu tư. Một số sản phẩm tài chính có thể không có sẵn ở quốc gia của bạn, và các thay đổi về quy định có thể ảnh hưởng đến điều kiện thị trường. Luôn đảm bảo tuân thủ luật pháp và quy định tài chính địa phương, giao dịch với các nhà môi giới hoặc sàn giao dịch uy tín và được quản lý, và tránh các nền tảng không được kiểm soát có thể gây rủi ro tài chính lớn.
Rủi ro liên quan đến công nghệ cũng không nên bị bỏ qua, vì giao dịch phụ thuộc nhiều vào các nền tảng giao dịch, kết nối internet và việc thực thi phần mềm. Việc thực thi chậm do internet chậm hoặc sự cố máy chủ có thể dẫn đến thua lỗ không mong muốn, sự cố hệ thống có thể khiến các vị thế mở lâu hơn dự định, và có rủi ro an ninh mạng khi sử dụng các nền tảng giao dịch trực tuyến.
Điều quan trọng cần lưu ý là tất cả thông tin giao dịch, chỉ báo, tín hiệu hoặc công cụ đều chỉ mang tính chất giáo dục và không nên coi là lời khuyên tài chính. Nhà giao dịch nên tự nghiên cứu và, nếu cần, tham khảo ý kiến cố vấn tài chính có giấy phép trước khi đưa ra quyết định đầu tư. Không có chỉ báo hay chiến lược nào đảm bảo lợi nhuận liên tục, và trách nhiệm cho tất cả các quyết định giao dịch hoàn toàn thuộc về nhà giao dịch cá nhân.
Quy tắc quan trọng nhất trong giao dịch là không bao giờ giao dịch bằng số tiền bạn không thể chịu mất. Giao dịch vốn dĩ có rủi ro, và thua lỗ có thể vượt quá số vốn đầu tư ban đầu. Chỉ giao dịch bằng thu nhập dư thừa mà bạn sẵn sàng mất, không bao giờ sử dụng tiền vay mượn hoặc chi phí sinh hoạt thiết yếu, và đa dạng hóa đầu tư để tránh đặt tất cả vốn vào một giao dịch hoặc tài sản duy nhất.
Giao dịch là một hoạt động rủi ro cao và không nên dựa vào như nguồn thu nhập chính. Nhiều nhà giao dịch thua lỗ, và chỉ một tỷ lệ nhỏ đạt được lợi nhuận lâu dài. Hãy đưa ra quyết định thông minh, quản lý rủi ro và luôn giao dịch có trách nhiệm. Bằng cách sử dụng bất kỳ nền tảng, công cụ hoặc chỉ báo giao dịch nào, bạn thừa nhận và chấp nhận các rủi ro liên quan đến giao dịch.
Giao dịch có trách nhiệm. Luôn cập nhật thông tin. Bảo vệ vốn của bạn. 🚀
Tóm tắt
Đánh giá của khách hàng
5 | 100 % | |
4 | 0 % | |
3 | 0 % | |
2 | 0 % | |
1 | 0 % |