Beschreibung
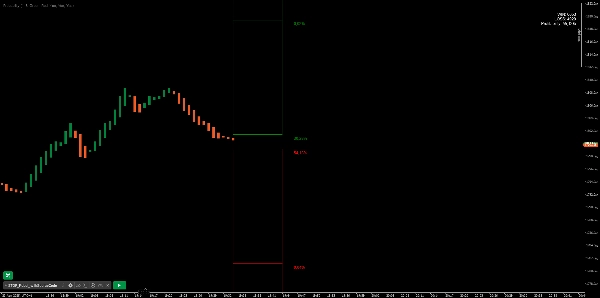
Breakout-Wahrscheinlichkeit ist ein wertvoller Indikator, der die Wahrscheinlichkeit eines neuen Hochs oder Tiefs berechnet und diese als Niveau mit Prozentangabe anzeigt. Die Wahrscheinlichkeit eines neuen Hochs und Tiefs wird rückwirkend getestet, und die Ergebnisse werden in einer Tabelle dargestellt – eine einfache Möglichkeit, die Wahrscheinlichkeit des nächsten Kerzenkörpers für ein neues Hoch oder Tief zu verstehen. Zusätzlich zeigt der Indikator vier weitere Niveaus oberhalb und unterhalb der Kerze mit der Wahrscheinlichkeit, diese Niveaus zu erreichen.
Der Indikator hilft Tradern, die Wahrscheinlichkeit der Richtung der nächsten Kerze zu verstehen, was zur Festlegung der eigenen Handelsrichtung genutzt werden kann.
█ Berechnungen
Der Algorithmus berechnet alle grünen und roten Kerzen separat, abhängig davon, ob die vorherige Kerze rot oder grün war, und vergibt Punkte, wenn eine oder mehrere Linien erreicht wurden. Anschließend berechnet der Algorithmus, wie viele Kerzen diese Niveaus in der Vergangenheit erreicht haben, und zeigt dies als Prozentwert auf jeder Linie an.
█ Beispiel
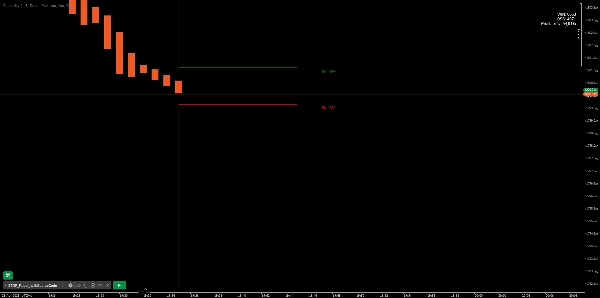
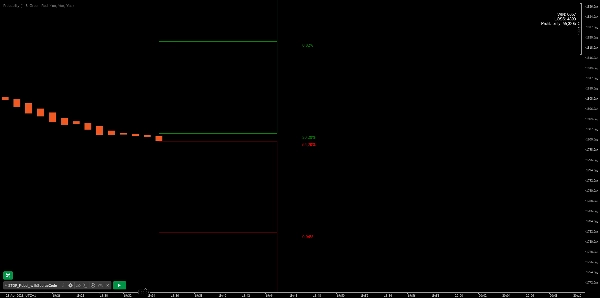
In diesem Beispiel war die vorherige Kerze grün; wir sehen, dass ein neues Hoch in 72,82 % der Fälle erreicht wurde und das Tief nur in 28,29 %. In diesem Fall wurde ein neues Hoch erzielt.
Zusammenfassung
Kundenbewertungen
5 | 100 % | |
4 | 0 % | |
3 | 0 % | |
2 | 0 % | |
1 | 0 % |