Mô tả
Đường Cao & Thấp ADR
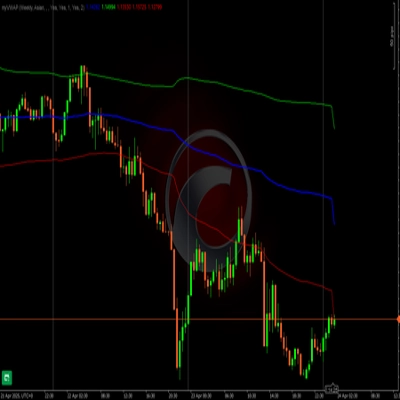
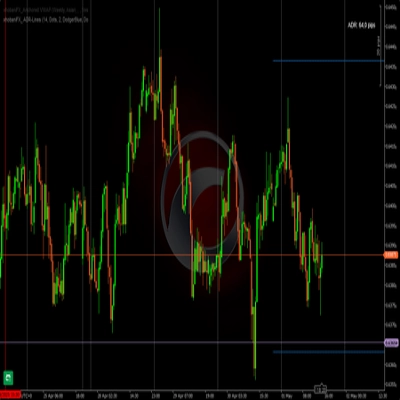
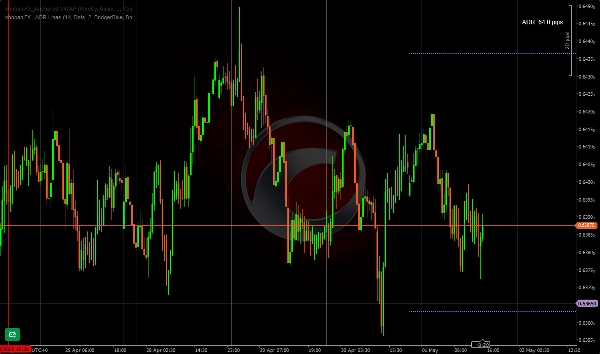
Chỉ báo ADR này vẽ các đường ngang cho mức thấp/cao của ngày hiện tại dựa trên khoảng thời gian mà nhà giao dịch ưa thích. Tôi thích và sử dụng 14 ngày làm khoảng thời gian cơ sở. Nó phù hợp nhất cho các nhà giao dịch lướt sóng/ngày. Vì vậy, bạn có thể dễ dàng nhận thấy khi nào mức cao/thấp đã được đạt tới, bạn có thể chọn màu/sắc thái/độ rộng của các đường để thay đổi sang màu khác theo ý muốn khi đạt được.
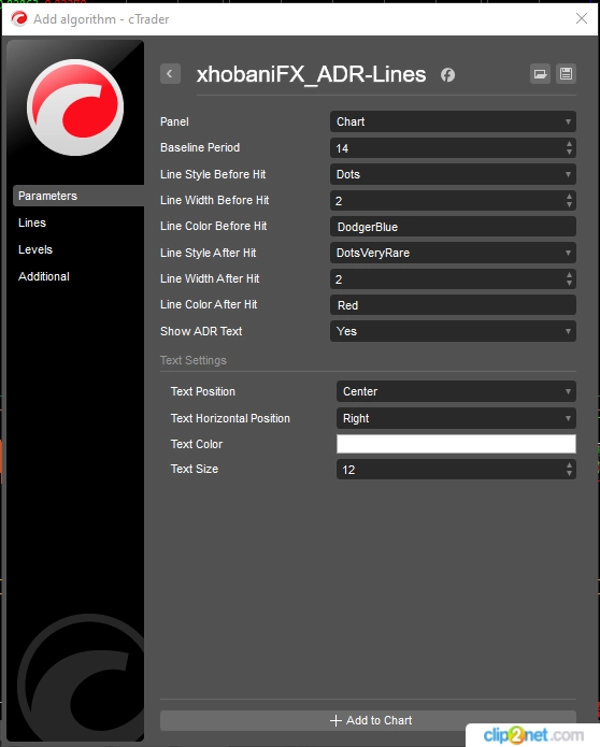
Chỉ báo này được phát triển sao cho bạn có thể tùy chỉnh hầu hết các tham số của nó để phù hợp với sở thích và đồng bộ với không gian làm việc cũng như màu sắc của bạn.
Chúc bạn giao dịch vui vẻ!
xhobani_FX
Tóm tắt
Tóm tắt AI
xhobaniFX_ADR-Lines is an Average Daily Range (ADR) indicator designed for scalpers and intraday traders. It plots horizontal lines representing the current day's high and low levels based on a user-defined period, with 14 days commonly used as a baseline. The indicator visually highlights when these high or low levels are reached by allowing customization of line color, style, and width to change upon being hit. Most parameters are adjustable to fit individual trading preferences and workspace aesthetics. This tool aids traders in quickly identifying key price levels within the trading day.
Hồ sơ chỉ báo
Đánh giá của khách hàng
4.0
Đánh giá: 2
5 | 0 % | |
4 | 100 % | |
3 | 0 % | |
2 | 0 % | |
1 | 0 % |
Thảo luận
Câu hỏi thường gặp
Các sản phẩm có sẵn trên cTrader Store, bao gồm bot giao dịch, chỉ báo và plugin, được cung cấp bởi các nhà phát triển bên thứ ba và chỉ nhằm mục đích cung cấp thông tin và tiếp cận kỹ thuật. cTrader Store không phải là nhà môi giới và không cung cấp lời khuyên đầu tư, khuyến nghị cá nhân hay bất kỳ đảm bảo nào về hiệu suất trong tương lai.