
说明
趋势可视化:
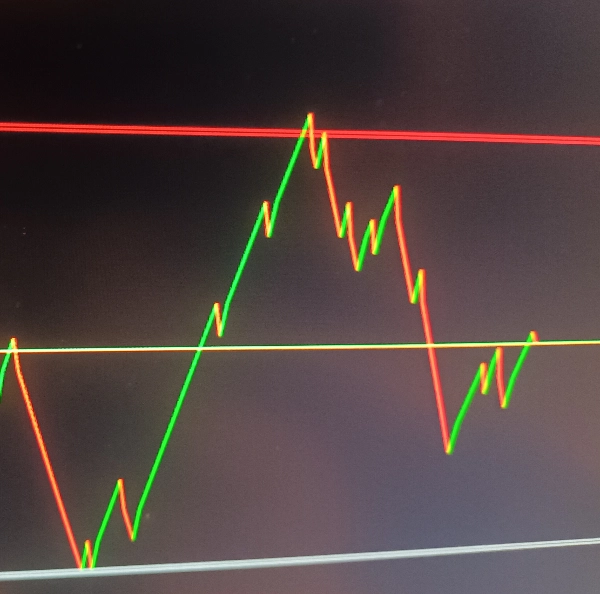
根据价格方向变化绘制趋势线(上涨趋势为绿色,下跌趋势为红色)
在图表上绘制黄色价格线
支撑/阻力区域:
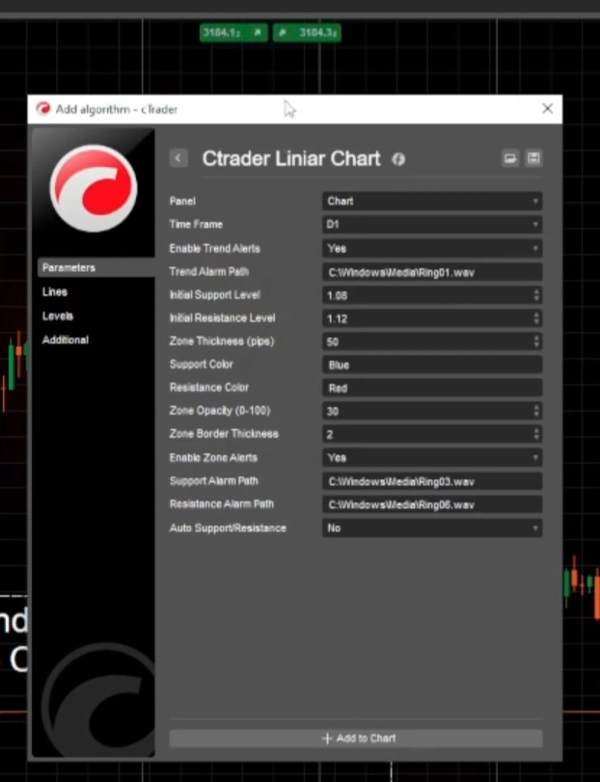
可配置的支撑和阻力水平,厚度可调(以点数计)
区域的自定义颜色和不透明度
可在图表上手动调整的交互式区域
警报系统:
趋势变化警报(当价格方向变化时)
支撑/阻力区域触发警报
不同事件的自定义声音警报
自动支撑/阻力:
趋势变化时可选的自动调整支撑/阻力水平
工作原理
设置所选时间框架(默认是每日)
使用默认或用户定义的值设置支撑/阻力水平
启动定时器定期检查区域调整
计算逻辑
对每个K线,比较当前收盘价与前一收盘价
确定当前趋势方向(上涨/下跌)
绘制当前价格与前一价格之间的趋势线
如果趋势方向发生变化:
可选地自动更新支撑/阻力水平
触发趋势警报(如果启用)
检查价格是否进入支撑/阻力区域并相应触发警报
区域管理
支撑/阻力区域以半透明矩形绘制
区域可在图表上手动调整,指标将跟踪这些更改
区域厚度以点数可配置
警报类型
趋势警报:当价格方向变化(上涨/下跌)时触发
区域警报:当价格进入支撑/阻力区域时触发
自动级别警报:启用自动支撑/阻力时,当这些水平自动调整时触发警报
时间框架选择
启用/禁用不同警报类型
不同警报的自定义声音文件路径
支撑/阻力水平。
摘要
AI 摘要
Ctrader Liniar Chart is a trading indicator designed to visually represent market trends and key price levels on selected time frames, with a default setting of Daily. It draws trend lines—green for uptrends and red for downtrends—based on changes in price direction by comparing each bar's close price to the previous one. A yellow price line is also plotted for reference.
The indicator features configurable support and resistance zones displayed as semi-transparent rectangles, with adjustable thickness in pips, customizable colors, and opacity. These zones are interactive and can be manually adjusted on the chart, with the indicator tracking any changes.
An alert system notifies users of trend changes, price entries into support/resistance zones, and automatic adjustments of these levels if the auto-support/resistance feature is enabled. Alerts can be customized with different sound files and can be enabled or disabled individually.
The indicator periodically checks for zone adjustments and updates support/resistance levels automatically when trends change, if configured. It supports time frame selection and provides a comprehensive visual and alert-based approach to monitoring price trends and critical levels in trading charts.
指标配置
客户评价
0.0
评价:0
客户评价
该产品尚无评价。已经试过了?抢先告诉其他人!
讨论
常见问答
cTrader Store 提供的所有产品,包括交易机器人、指标和插件,均由第三方开发者提供,仅供信息参考和技术访问之用。cTrader Store 并非经纪商,不提供投资建议、个人推荐或任何未来业绩保证。
该作者的其他作品


价格
注册日期 28/01/2025
7
销售
337
免费安装