
Time To Break Even Lite Version
指标
62 下载
版本 1.0, May 2025
Windows 版、Mac 版
说明
盈亏平衡时间指标 LITE
简化版
这是盈亏平衡时间指标的免费试用版本。 仅限于 EURGBP,且仅运行2分钟。
盈亏平衡时间指标
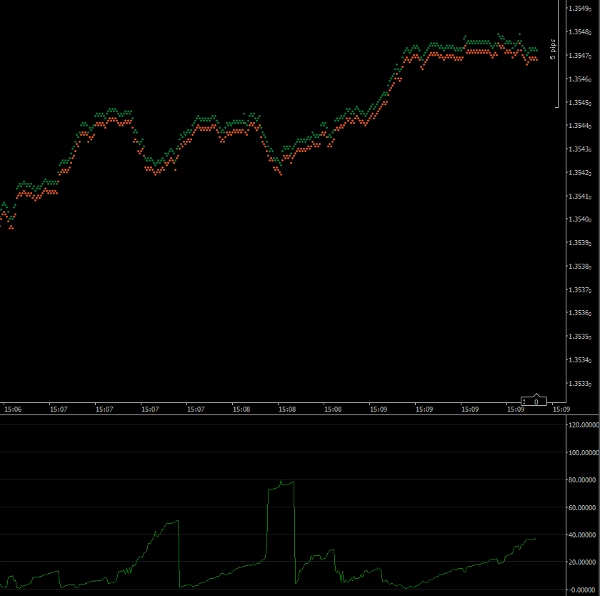
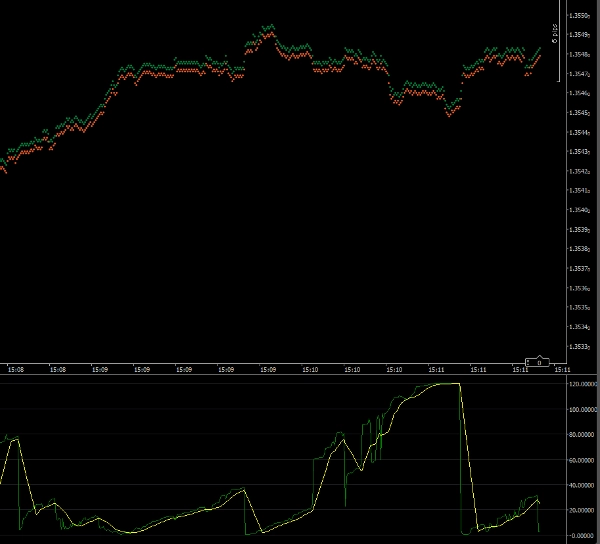
该指标将帮助您把握交易进入市场的时机。图表显示您的交易达到盈亏平衡所需的可能秒数。如果市场快速且朝您的方向移动,指标将显示较小的数字。如果市场逆向或移动缓慢,数字则会更大。
该指标计算您的交易达到盈亏平衡所需的点数,然后将其与当前价格移动速度进行比较。
注意:该指标应在1 Tick时间框架上运行。
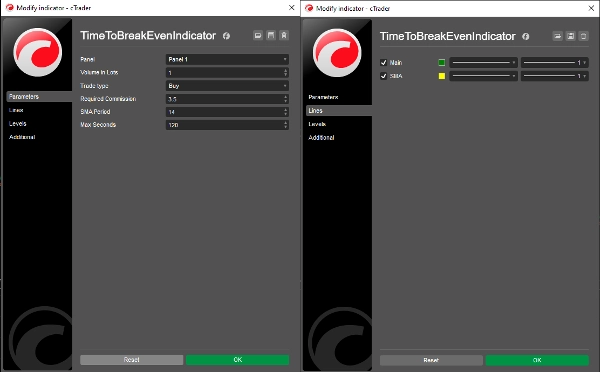
参数
手数:您拟进行交易的手数
交易类型:您的交易是买入还是卖出
所需佣金:您的交易将产生的佣金(可从快速交易窗口获取)
简单移动平均周期:简单移动平均线的周期(默认=14)
最大秒数:将被记录的最大秒数(见下文)
线条
主线:指标绘图线(默认=绿色)
简单移动平均线:简单移动平均线绘图线(默认=黄色)
最大秒数
允许指标显示非常大的数值意味着当盈亏平衡时间较小时,指标的刻度会阻碍您看到细节。设置此参数可让您设定指标的最大刻度。默认设置为120秒(2分钟)。因此,任何2分钟或以上的输出都将绘制为120秒。
安迪·拉金博士
版权所有 2025,保留所有权利
2025年5月26日
法律声明
使用本指标的结果应在实际交易前进行准确性核查。
本指标的结果不提供任何明示或暗示的保证。
因使用本指标而产生的任何损失,概不负责。
摘要
AI 摘要
Time To Break Even Lite Version is a trial indicator designed to assist traders in timing their trade entries. It estimates the likely number of seconds required for a trade to reach break-even by calculating the pips needed and comparing this with the current price movement speed. A smaller value indicates a fast-moving market in the trade's favor, while a larger value suggests slower or adverse movement. This lite version is limited to the EURGBP currency pair and operates for a maximum of two minutes. It is intended for use on the 1 Tick Time Frame. Key adjustable parameters include trade volume (lots), trade type (buy or sell), required commission, Simple Moving Average (SMA) period (default 14), and maximum seconds displayed (default 120 seconds). The indicator plots two lines: the main indicator line (default green) and the SMA line (default yellow). Users should verify indicator results before live trading, as no warranty or liability is provided.
指标配置
客户评价
0.0
评价:0
客户评价
该产品尚无评价。已经试过了?抢先告诉其他人!
讨论
常见问答
cTrader Store 提供的所有产品,包括交易机器人、指标和插件,均由第三方开发者提供,仅供信息参考和技术访问之用。cTrader Store 并非经纪商,不提供投资建议、个人推荐或任何未来业绩保证。
该作者的其他作品


猜您喜欢


!["[Stellar Strategies] Inside Bar with Signals" 标识](https://cdn.ctrader.com/image/webp/1d9e8bfa-3b2c-4440-bb37-5856902008a7_30683)


价格
注册日期 26/05/2025
241
免费安装