
Time To Break Even Indicator v2
指标
版本 1.0, May 2025
Windows 版、Mac 版
4.5
评价:2
说明
盈亏平衡时间指示器 v2
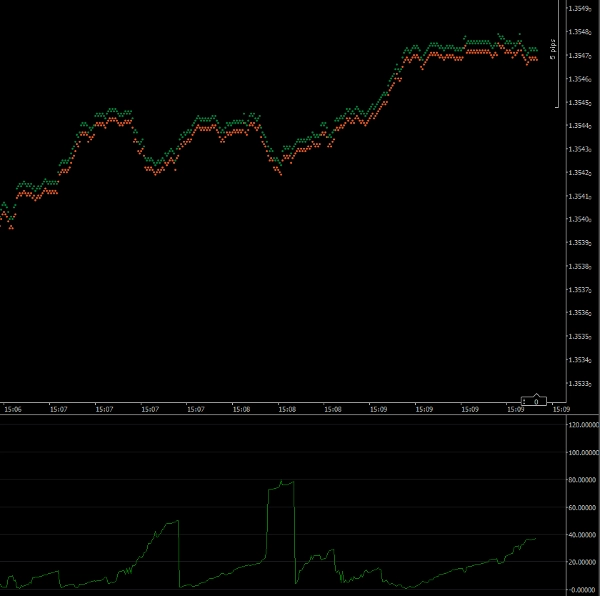
此指示器将帮助您把握交易进入市场的时机。图表显示您的交易达到盈亏平衡所需的可能秒数。如果市场快速且朝您的方向移动,指示器将显示较小的数字。如果市场逆向或移动缓慢,数字将较大。
该指示器计算您的交易达到盈亏平衡所需的点数,然后将其与当前价格移动速度进行比较。
注意:此指示器应在1 Tick时间框架上运行。
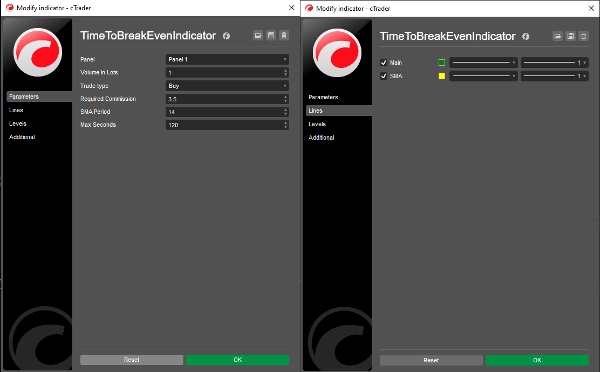
参数
手数:您拟交易的交易量
交易类型:您的交易是买入还是卖出
所需佣金:您的交易将产生的佣金(您可以从快速交易窗口获取)
简单移动平均期数:简单移动平均线的周期(默认 = 14)
最大秒数:将记录的最大秒数(见下文)
线条
主线:指示器绘图线(默认 = 绿色)
简单移动平均线:简单移动平均线绘图线(默认 = 黄色)
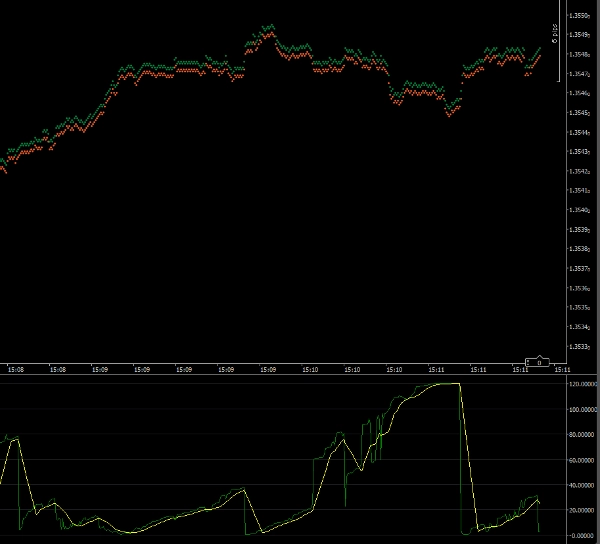
最大秒数
允许指示器显示非常大的值意味着指示器的刻度会阻止您在盈亏平衡时间较短时看到细节。设置此参数可让您设定指示器的最大刻度。默认设置为120秒(2分钟)。因此,任何2分钟或更长时间的输出都将绘制为120秒。
安迪·拉金博士
版权所有 2025,保留所有权利
2025年5月26日
法律声明
使用此指示器的结果应在实盘交易前进行准确性检查。
对于此指示器的结果不提供任何明示或暗示的保证。
因使用此指示器而产生的任何损失概不负责。
摘要
指标配置
客户评价
4.5
评价:2
5 | 50 % | |
4 | 50 % | |
3 | 0 % | |
2 | 0 % | |
1 | 0 % |
客户评价
May 31, 2025
The setup improves when it adds a useful layer without forcing action. A clean signal can still fail.
讨论
常见问答
cTrader Store 提供的所有产品,包括交易机器人、指标和插件,均由第三方开发者提供,仅供信息参考和技术访问之用。cTrader Store 并非经纪商,不提供投资建议、个人推荐或任何未来业绩保证。
该作者的其他作品


!["High-Low Divergence [Iridio Capital]" 标识](https://cdn.ctrader.com/image/webp/443c4661-7abb-40f1-842f-4b6ec560649b_40914)


价格
注册日期 26/05/2025
240
免费安装