Fury Team E_M_A_su_TF
"Fury Team E_M_A_su_TF" 标识
03/09/2025
Desktop
Since 25/09/2024
交易额
124.84M
盈利点数
1.11M
"Fury Team E_M_A_su_TF" 已上传图片

// ══════════════════════════════════════ ══════════════════════════════════════
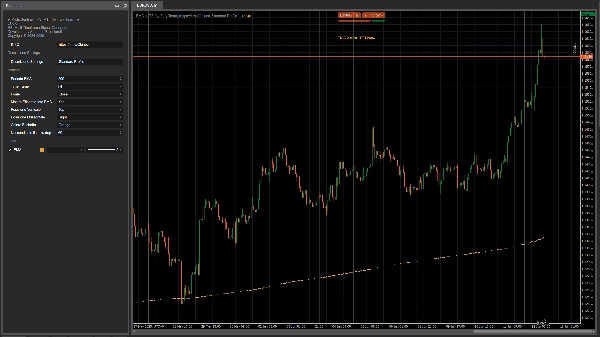
// 📊 INDICATOR EMA ON TF (MULTI-TIMEFRAME)

// Version: 1.0.0 - Professional indicator for multi-timeframe analysis

// Author: Fury Team - Armando Brecciaroli

// Date: June 5, 2025

// ══════════════════════════════════════════════════════════════════════════

//

// DESCRIPTION:

// ===========

// EMA on TF is an advanced indicator that displays the exponential moving average

// (EMA) calculated on a specific timeframe and projected onto the current

// timeframe of the chart. This tool allows you to use moving averages of higher timeframes

// (e.g. H4, D1) even on charts with lower timeframes (M15, H1),

// allowing a complete and immediate multi-timeframe analysis.

//

// KEY FEATURES:

// ==========================

// - Display of EMA of any timeframe on the current chart

// - Full support for all timeframes available in cTrader

// - Full customization of EMA period and price source

// - Management of information label with flexible positioning

// - Secure licensing system and automatic update check

// - Fully optimized for high performance even on large datasets

// - Full customization of visual appearance (colors, line style)

//

// PRACTICAL USES:

// ================

// - Identify long-term trend on lower timeframe chart

// - Display significant averages of higher timeframes

// - Create multi-timeframe strategies based on moving averages

// - Identify dynamic supports and resistances more reliable

//

// CHANGELOG:

// =========

// v1.0.0 (05/06/2025)

// - Initial release with full support for all timeframes

// - Implementation of advanced license management system

// - Customizable user interface with informative HUD

// - Added informative label on the chart

// - Integrated automatic update system

// - Performance optimization for extended time series

// - Support for all price sources (Close, Open, High, Low, etc.)

// - Automatic management of system message display

// ═══════════════════════════════════════════════════════════════════════════════


To enable the license follow the info on screen or in the logs.


猜您喜欢
指标
Grid
RSI
ATR
+6
PFO Price Flow Oscillator
technical analysis tool designed to provide traders with a structured view of market momentum and volatility
指标
Stocks
Commodities
Forex
+1
Support & Resistance Pro
The Support & Resistance Pro helps traders identify key support and resistance levels for informed trading decisions.
ictkillzonesfromnovem
ICT ALL KİLL ZONES, LONDON , ASİA, NY AM, NY LUNCH, NY PM
指标
Bollinger
Repiptor BB Colored Width
Colored Bollinger Bands Width
指标
Indices
Breakout
Supertrend
[CB] Pivot Points Pro
You can use the cTrader Pivot Points Pro indicator to find a good pullback entry in a trend
Supply Demand V1-Premium
Auto-detect supply & demand zones, remove broken levels, and trade smarter with real-time alerts. Precision made simple.
指标
Grid
RSI
Breakout
+6
Final Stochastic Oscillator
Final Stochastic Oscillator is a next-generation upgrade of the classic stochastic indicator
OHLC PRO by LudwigICT
OHLC PRO – Advanced Session & Market Structure Tool
指标
XAUUSD
Breakout
Forex
+4
Market Bias Gauge
Measure Market Strength at a Glance – Instantly
BLOCK LIQUIDITY PRO
Block Liquidity,indicator.Block Order, Liquids Stops, Signal Sentiment,signal correctio.
IVB 2.0
IVB 2.0 is an indicator that works on the strategy of imbalance of the maximum volatility box of indices
指标
NAS100
Breakout
XAUUSD
+12
Cross EMA Pro
Cross EMA Pro – Trend Reversal Indicator
指标
Breakout
AI
Scalping
KaufmanEfficiencyRatio
A precision tool for measuring how efficiently price moves from point A to B.
Laguerre RSI
Laguerre RSI is based on John EHLERS' Laguerre Filter to avoid the noise of RSI.
BarCount
Bar count
SessionPowerZonesPro
Highlights market sessions & overlaps with real-time range & volume stats – perfect for pro scalpers.
指标
RSI
Breakout
XAUUSD
+13
Fear & Greed Index
Fear & Greed Index: 4 configurable components (momentum, volatility, strength, pattern) with 6 calculation methods each