
说明
📈 随机 RSI
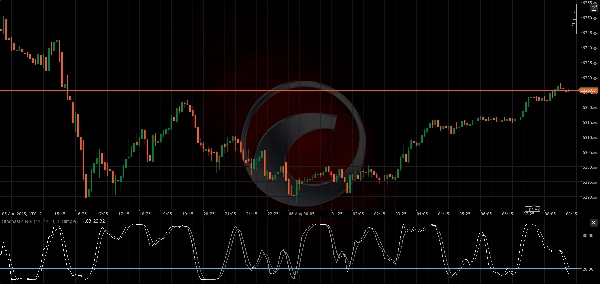
随机 RSI 指标是一种动量振荡器,它将 随机公式应用于 RSI 值 而非价格,使其成为一个 二阶导数指标。它特别适用于以比标准 RSI 更高的灵敏度识别超买和超卖状态。
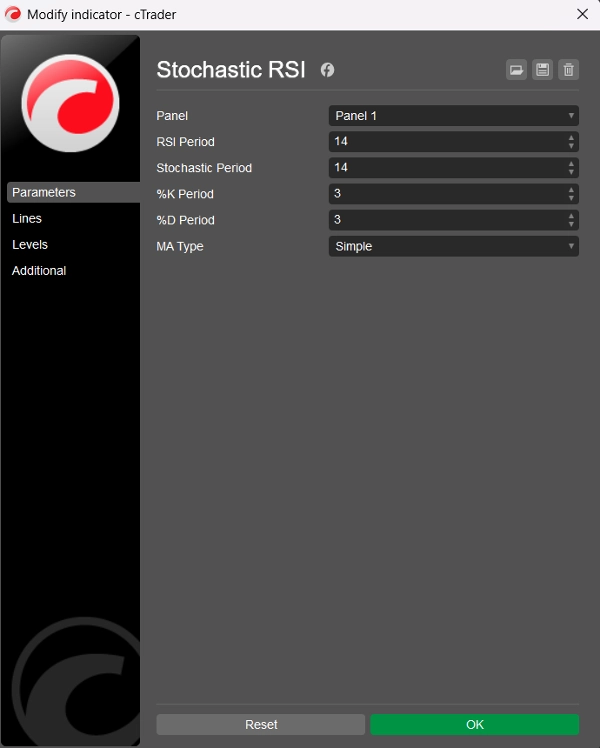
🛠️ 参数
RSI 周期: 用于计算基础 RSI 的回溯周期(默认 = 14)
随机周期: 应用于 RSI 值以计算随机 RSI 的回溯周期(默认 = 14)
%K 周期: %K 线的平滑周期(默认 = 3)
%D 周期: %D 线的平滑周期(默认 = 3)
移动平均类型: 用于平滑的移动平均类型:11 种类型可选(默认 = 简单)
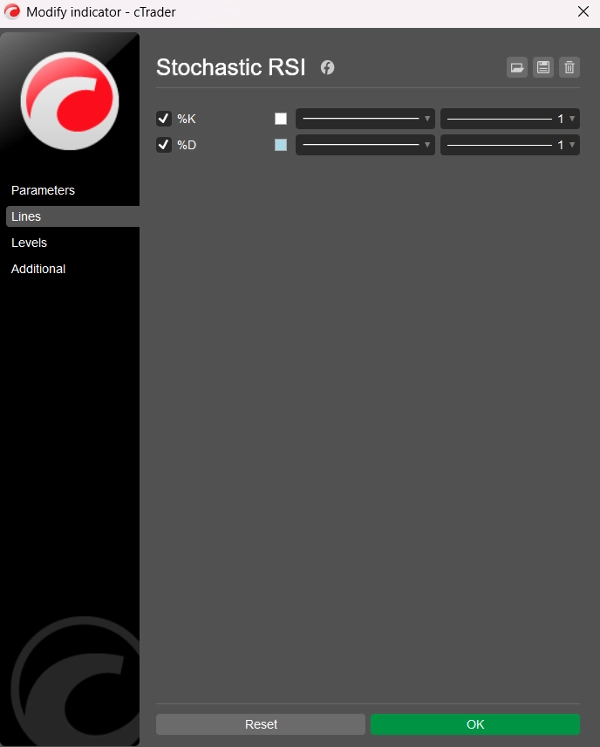
📊 输出线
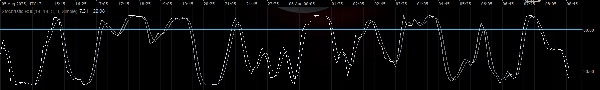
- %K 线:平滑的随机 RSI(白色)
- %D 线:%K 的平滑移动平均线(浅蓝色)
两条线都在 0 到 100 之间振荡,便于清晰识别超买和超卖信号。
⚠️ 建议水平
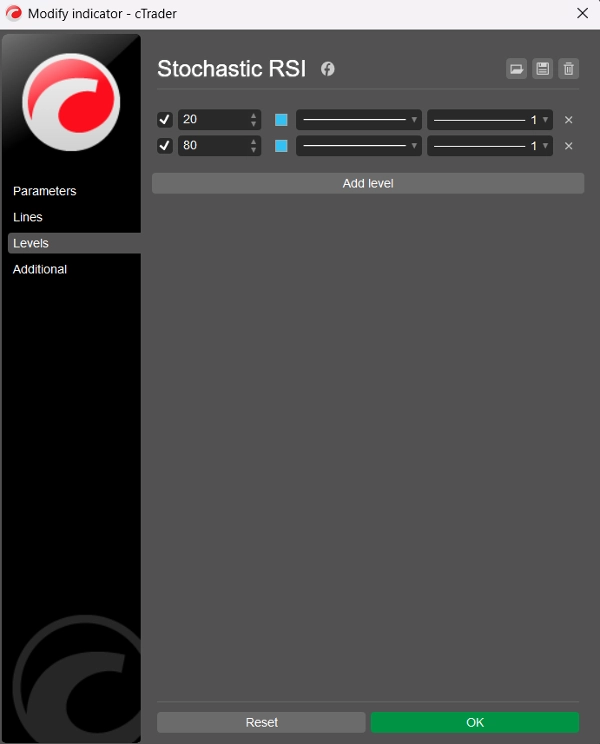
虽然该指标默认不显示静态水平,但建议用户通过 cTrader 中的 “水平”标签手动添加:
- 水平 80 → 超买
- 水平 20 → 超卖
这些水平类似于传统随机振荡器,但应用于 RSI 行为,使信号更锐利且通常更快。
🧠 使用方法
- 超买 (>80):可能表示价格向上过度延伸——可能出现反转或盘整。
- 超卖 (<20):可能表示价格超卖——可能反弹或趋势反转。
- %K 和 %D 交叉:可类似于随机指标或 MACD 使用——20 以下的看涨交叉或 80 以上的看跌交叉可能具有操作意义。
🏷️ 备注
- 基于 C# 和 Automate API 为 cTrader 构建
- 简洁、高效,可自定义 11 种移动平均类型
- 代码和逻辑由 BlueRocketBots & ChatGPT (OpenAI) 提供
- 代码整洁(共 99 行;54 行代码,27 行文本,18 行空行)
- V2 改进版本
- 免费提供!
摘要
AI 摘要
The Stochastic RSI Indicator is a momentum oscillator designed for use on the cTrader platform. It applies the Stochastic formula to Relative Strength Index (RSI) values instead of price data, effectively acting as a second-derivative indicator. This approach enhances sensitivity in detecting overbought and oversold market conditions compared to the standard RSI.
Key parameters include the RSI Period (default 14), Stochastic Period (default 14), %K and %D smoothing periods (default 3 each), and a choice among 11 moving average types for smoothing (default is Simple). The indicator outputs two lines: the %K line (smoothed Stochastic RSI) and the %D line (smoothed moving average of %K), both oscillating between 0 and 100.
Suggested manual levels for interpretation are 80 (overbought) and 20 (oversold). Traders may use these levels along with %K and %D crossovers to identify potential price reversals or consolidations. For example, a bullish crossover below 20 or a bearish crossover above 80 can signal actionable market moves.
The indicator is implemented in clean, efficient C# code using the Automate API, allowing customization and integration within cTrader.
指标配置
客户评价
0.0
评价:0
客户评价
该产品尚无评价。已经试过了?抢先告诉其他人!
讨论
常见问答
cTrader Store 提供的所有产品,包括交易机器人、指标和插件,均由第三方开发者提供,仅供信息参考和技术访问之用。cTrader Store 并非经纪商,不提供投资建议、个人推荐或任何未来业绩保证。
猜您喜欢


价格
注册日期 24/05/2025
222
免费安装