
50 percent
指标
版本 1.0, Aug 2025
Windows 版、Mac 版
5.0
评价:2

说明
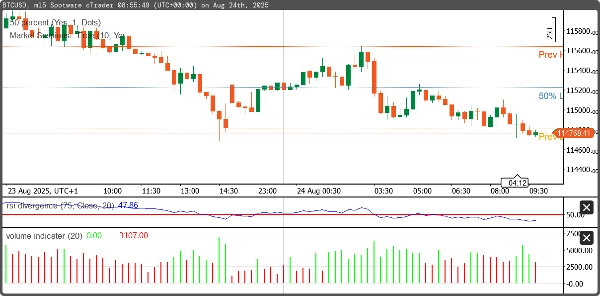
此cBot会自动检测前一交易时段的最高价和最低价,并计算它们之间的中点。它旨在通过识别关键的支撑/阻力区域和市场均衡水平来帮助交易者,这些通常用于反转或突破策略。
- 检测前一天(或交易时段)的最高价和最低价。
- 计算最高价和最低价之间的中点。
- 在图表上绘制最高价、最低价和中点水平。
摘要
指标配置
客户评价
5.0
评价:2
5 | 100 % | |
4 | 0 % | |
3 | 0 % | |
2 | 0 % | |
1 | 0 % |
客户评价
August 29, 2025
The screen feels less crowded, but the final call still needs say no.
August 20, 2025
讨论
常见问答
cTrader Store 提供的所有产品,包括交易机器人、指标和插件,均由第三方开发者提供,仅供信息参考和技术访问之用。cTrader Store 并非经纪商,不提供投资建议、个人推荐或任何未来业绩保证。
该作者的其他作品


价格
注册日期 14/05/2025
10.1M
交易量
81.44K
盈利点数
205
免费安装