
说明
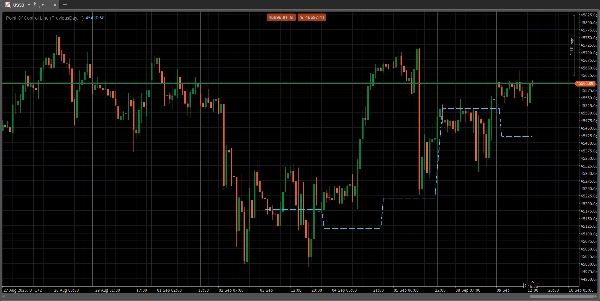
控制点(POC)是成交量分布图上的一个价格水平,在指定期间内该价格水平的交易量最大。这个水平作为一个重要的支撑或阻力区域,因为它代表了大型交易机构最活跃的价格点,也是市场价格达成共识的地方。交易者利用POC来识别关键价格区域,评估市场情绪,并预测潜在的价格走势和反转。
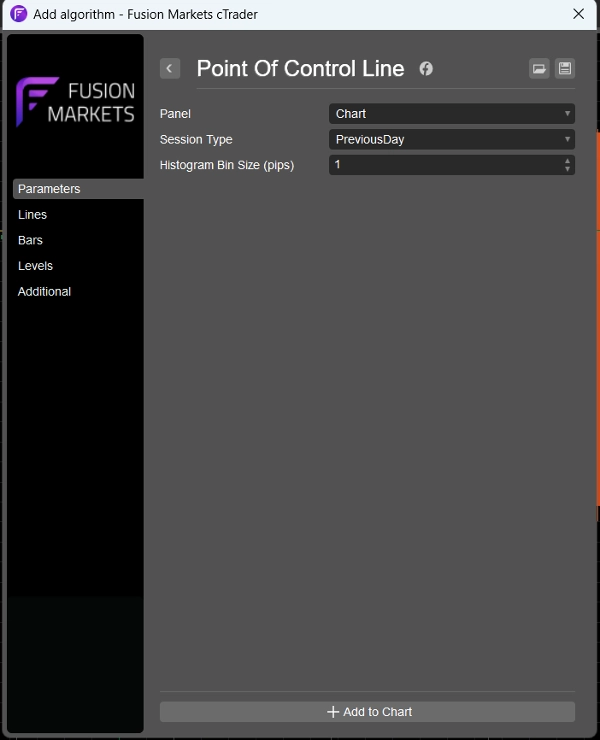
我已从常见的成交量分布指标中去除了所有噪音,仅保留了POC线,适合只需要该线的用户。我还包含了一个参数,可以查看前一天、4小时或1小时成交量分布的POC线,适合不同时间框架的交易者。
摘要
指标配置
客户评价
5.0
评价:2
5 | 100 % | |
4 | 0 % | |
3 | 0 % | |
2 | 0 % | |
1 | 0 % |
客户评价
September 16, 2025
The log becomes easier to read, but impatience can still break the idea.
September 15, 2025
讨论
常见问答
Forex
Indices
cTrader Store 提供的所有产品,包括交易机器人、指标和插件,均由第三方开发者提供,仅供信息参考和技术访问之用。cTrader Store 并非经纪商,不提供投资建议、个人推荐或任何未来业绩保证。


!["[Stellar Strategies] Market Session Ultimate" 标识](https://cdn.ctrader.com/image/webp/61ffd537-0125-4246-9e72-42eca1791d64_28232)


价格
注册日期 21/04/2025