Market Swing Structure Pullback Pro
Индикатор
Версия 1.0, Sep 2025
Windows, Mac
Описание
«Торговля связана с риском. Прошлые результаты не гарантируют будущих.»
Сводка
ИИ-сводка
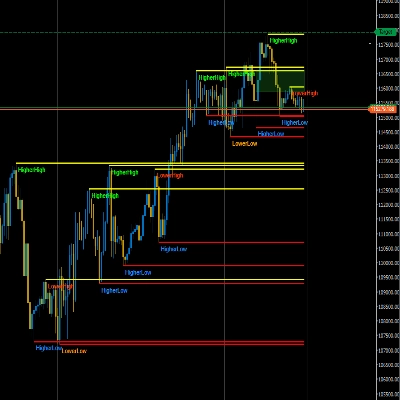
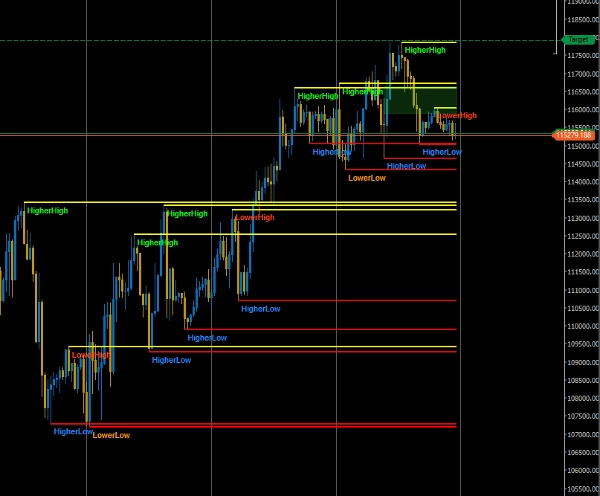
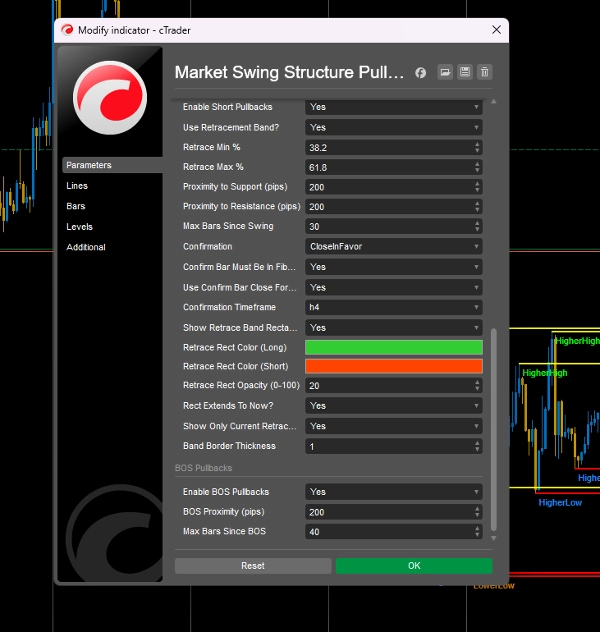
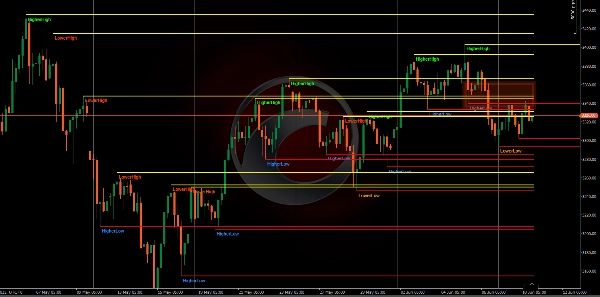
Market Swing Structure Pullback Pro is a trading indicator designed to automatically detect key market levels such as support and resistance and structural points. It highlights pullbacks and break of structure (BOS) retests, providing visual cues for potential trade entries. The indicator incorporates candle confirmation to filter signals, aiming to improve the accuracy of trade setups. It supports multiple markets including Forex, cryptocurrencies (e.g., BTCUSD, ETH), commodities (e.g., gold, oil), indices (e.g., NAS100, SP500), and stocks. Key features include automatic identification of swing structures, highlighting of pullback zones, and integration of candle pattern validation. This tool is intended for use on various symbols and timeframes to assist traders in identifying potential reversal or continuation points based on market structure analysis.
Профиль индикатора
Отзывы покупателей
0.0
Отзывы: 0
Отзывы покупателей
У этого продукта еще нет отзывов. Уже попробовали его? Поделитесь впечатлениями!
Обсуждение
Частые вопросы
BTCUSD
Forex
Signal
Breakout
Indices
EURUSD
Commodities
GBPUSD
NZDUSD
Prop
Supertrend
Crypto
Stocks
XAUUSD
NAS100
USDJPY
Продукты, доступные в cTrader Store, включая торговых ботов, индикаторы и плагины, предоставляются сторонними разработчиками и доступны исключительно в информационных и технических целях. cTrader Store не является брокером и не предоставляет инвестиционные консультации, персональные рекомендации или какие-либо гарантии будущей доходности.


Цена
С 31/10/2024
56
Продажи
1.75K
Бесплатные установки