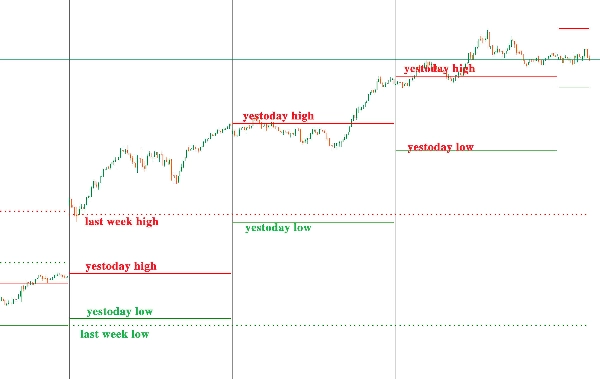
指标
Indices
Breakout
Commodities
Forex
Signal
Crypto
Daily Levels
"Daily Levels" 标识
09/10/2025
Desktop
"Daily Levels" 已上传图片"Daily Levels" 已上传图片

The "Daily Levels" indicator is used to display last week's high/low and yesterday's high/low across different timeframes.
Last week's high/low: Marked with thick dashed lines;
Yesterday's high/low: Marked with thin solid lines.
Users can customize colors and line thickness.

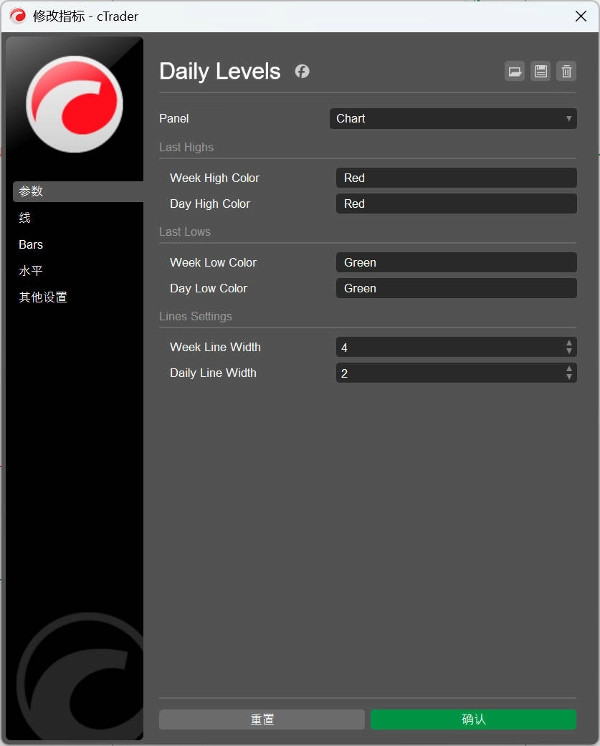
“Daily Levels”指标用于在不同的时框框架下显示上周最高价/最低价和昨天最高价/最低价。
上周最高/最低价:使用粗虚线标注;
昨天最高/最低价:使用细实线标注。
用户可以自定义颜色和线条粗细。

0.0
评价:0
客户评价
该产品尚无评价。已经试过了?抢先告诉其他人!
该作者的其他作品
指标
Indices
Breakout
Prop
+4
Pivot Points Daily Session
Pivot Point with base zone daily Asia-London-New york Session.
指标
VWAP
Indices
Prop
+4
Volume Weighted Average Price
VWAP is a powerful tool for intraday traders
指标
Indices
Prop
Stocks
+3
IRiskRewardTools
Risk Reward Management Tools(风险回报管理工具)
指标
RSI
Indices
Prop
+6
ZigZagColor
The ZigZag indicator is a technical analysis tool primarily used to identify key price reversal points.
指标
Indices
Breakout
Prop
+4
Higher TimeFrame Candle Tracker
Higher TimeFrame Candle Tracker: Current Timeframe (Any TimeFrame) Show High TimeFrame Candle Bar
指标
Indices
RSI
Prop
+4
SuperEmaColorRSI
This is a super indicator that integrates the RSI indicator with a dual moving average system.
猜您喜欢
指标
NAS100
RSI
NZDUSD
+15
RSI + EMA Crossover Signals
Dual confirmation RSI + EMA crossover signals with visual alerts and dynamic ATR offsets.
AlphaTrend Pro by LudwigICT
指标
NAS100
Indices
XAUUSD
+4
PrevDayProjection
Automatically calculates the previous day’s high and low, determines the range, and then projects Fibonacci levels.
指标
Signal
[Stellar Strategies] Wave Trend Pro
Momentum oscillator identifying reversals using dual WaveTrend lines, histogram, and OB/OS levels with optional signals.
Golden Boom And Crash Spike Detector
Golden Boom and Crash Spike Detector is a trading tool designed for Crash 300 and Boom 300 indices on M1 Timeframe.
指标
Indices
RSI
RSI
RSI Pro Tool – Overbought & Oversold Made Easy
MTF Candle Window - On Chart
The Multi-Timeframe Candle Indicator displays candles from multiple timeframes in one window, enhancing market analysis!
指标
NAS100
NZDUSD
XAUUSD
+14
MacD Custom Indicator Multi Time Frame
MacD Custom Indicator-Multiple Time Frame+All Available Options!
Zig zag v.1 Demo
ZigZag Pro DEMO – Multi-Swing Indicator for cTrader DEMO VERSION – 24 hours free trial! This is a DEMO version of the Z
指标
NAS100
EURUSD
GBPUSD
Ema
An exponential moving average based on regular trading hours.
指标
RSI
Breakout
Supertrend
Adaptive Trend Channel
📊 Visualize market trends more clearly and dynamically
指标
Grid
NAS100
RSI
+21
Market Cipher B
Market Cipher B
指标
RSI
Breakout
XAUUSD
+6
Fair Value Gap Sessions
identify and highlight temporary market inefficiencies known as "fair value gaps" 🚨 within specific trading Sessions.
指标
Breakout
Stocks
Signal
Darvas Box
The Darvas Box involves identifying "boxes" or trading ranges where a stock's price consolidates before breaking out.
指标
Indices
Prop
Stocks
+3
LT_Ind_SRZones
Automatic Support/Resistance zones from swing points.
指标
RSI
Breakout
Supertrend
Swing Levels
🔍 Automatically detect support and resistance levels based on "swings" or pivots
指标
Indices
Commodities
Forex
Institutional FVG Zones MTF with Confluence
Professional Fair Value Gaps with multitimeframe spot on
指标
Indices
RSI
XAUUSD
+5
cAlgoBuddy - Composite Index RSI
What Constance Brown did with the RSI was to input a momentum calculation within the RSI itself. This the Composite RSI.