
说明
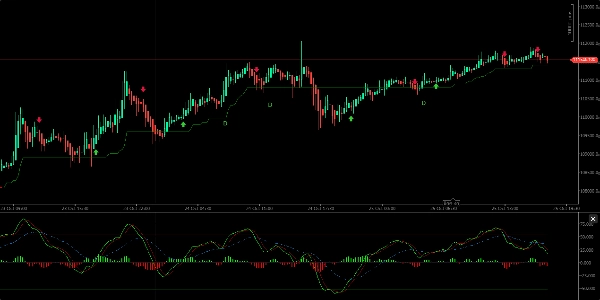
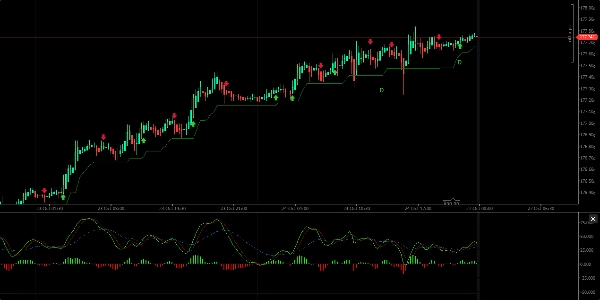
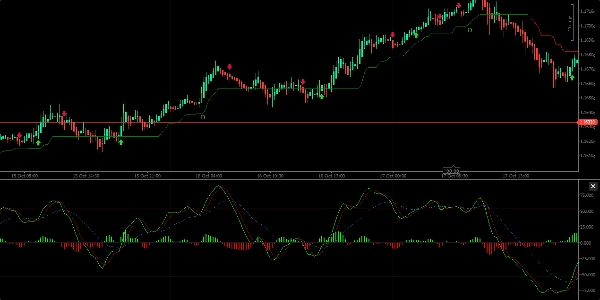
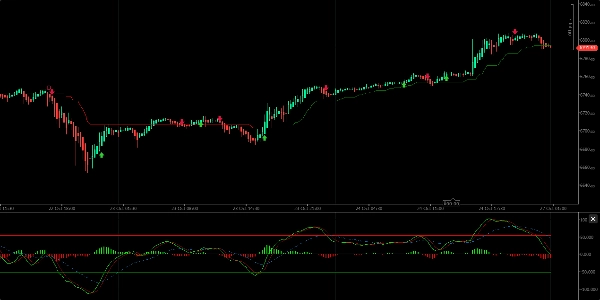
它提供买卖信号、趋势方向指示,并识别超买和超卖区域。视觉上,它由两条数值线和中间的云层/柱状图组成,云层在中线的上下移动,代表上升或下降的趋势。
主要特点:
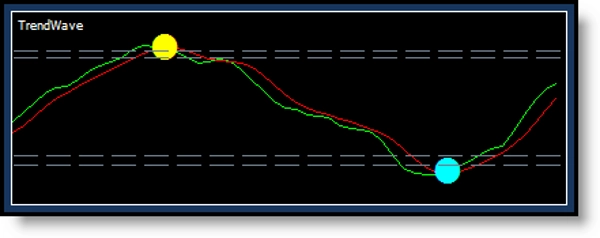
- 当绿色线向上穿过红色线时产生买入信号;当绿色线向下穿过时产生卖出信号。
- 通过云层波动显示趋势方向,云层位于中线的上方或下方。
- 指标在交叉点显示绿色(买入)和红色(卖出)点,同时对应的蜡烛颜色变化(买入为黄色,卖出为绿松石色)。
- 最好在12小时或1天的时间间隔上使用,以避免过多的短期噪音。
- 该指标可以识别价格与动量之间的背离(常规的看涨和看跌背离),提示潜在的价格反转。
- 建议将WaveTrend与其他指标如WMA、CMF、RSI和MACD结合使用,以获得更可靠的交易决策。
总体而言,WaveTrend是一个功能性工具,有助于识别趋势方向和交易信号,但应与其他分析工具结合使用以确认信号。
摘要
指标配置
客户评价
5.0
评价:2
5 | 100 % | |
4 | 0 % | |
3 | 0 % | |
2 | 0 % | |
1 | 0 % |
客户评价
November 6, 2025
the main upside is the trade idea gets slowed down first. The setup still needs say no.
讨论
常见问答
Signal
ZigZag
EURUSD
Supertrend
GBPUSD
RSI
XAUUSD
NAS100
ATR
MACD
cTrader Store 提供的所有产品,包括交易机器人、指标和插件,均由第三方开发者提供,仅供信息参考和技术访问之用。cTrader Store 并非经纪商,不提供投资建议、个人推荐或任何未来业绩保证。


价格
注册日期 16/03/2025
256
免费安装