说明
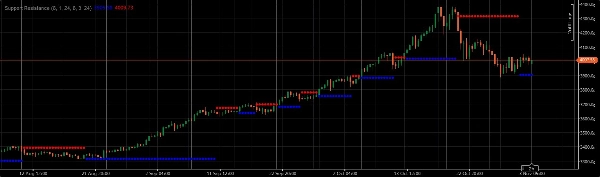
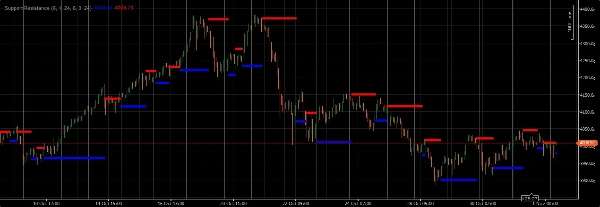
在交易黄金时,使用不同时间框架(大图表、区间图和逐笔图)上的支撑和阻力位来识别潜在的枢轴突破或支撑/阻力点。始终结合其他技术指标,如移动平均线、振荡器和蜡烛图形态,确认这些信号,以提高交易的成功概率
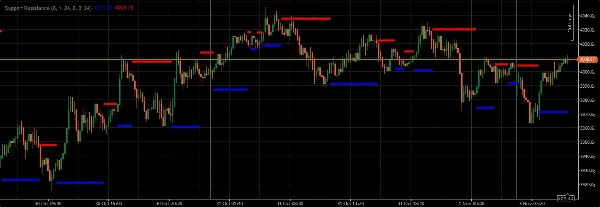
在交易黄金时,使用不同时间框架(大图表、区间图和逐笔图)上的支撑和阻力位来识别潜在的枢轴突破或支撑/阻力点。在交易黄金时,使用不同时间框架(大图表、区间图和逐笔图)上的支撑和阻力位来识别潜在的枢轴突破或支撑/阻力点。一旦确定,这些水平可以作为关键的决策点。突破阻力位或跌破支撑位,尤其是伴随着实体蜡烛的增加,通常预示着趋势的延续或市场情绪的重大转变。相反,从支撑位反弹或在阻力位被拒绝,可能表明潜在的反转或当前盘整的延续。始终结合其他技术指标,如移动平均线、振荡器和蜡烛图形态,确认这些信号,以提高交易的成功概率。此外,密切关注新闻事件和经济数据发布,因为这些可能会显著影响黄金价格并使纯技术形态失效。风险管理至关重要;绝不要在任何单笔交易中冒超过交易资本小部分的风险。
摘要
AI 摘要
The Support Resistance indicator identifies key support and resistance levels across multiple timeframes, including large, range, and tick charts, primarily for trading gold (XAUUSD). It helps traders detect potential pivot breakouts or critical price points where price action may reverse or continue. Breakouts above resistance or below support, especially with strong candle bodies, can signal trend continuation or shifts in market sentiment. Conversely, price bounces or rejections at these levels may indicate reversals or consolidation phases. The indicator is designed to be used alongside other technical tools such as moving averages, oscillators, and candlestick patterns to improve trade signal reliability. It is applicable to various markets including Forex pairs like EURUSD, GBPUSD, NZDUSD, and USDJPY, as well as commodities like gold. Users are advised to consider fundamental factors like news and economic data releases, which can impact price behavior. The indicator supports strategies including breakout and scalping trading styles. Risk management principles are emphasized, recommending limited capital exposure per trade.
指标配置
客户评价
5.0
评价:2
5 | 100 % | |
4 | 0 % | |
3 | 0 % | |
2 | 0 % | |
1 | 0 % |
讨论
常见问答
Forex
Breakout
Scalping
EURUSD
Commodities
GBPUSD
NZDUSD
XAUUSD
ATR
USDJPY
cTrader Store 提供的所有产品,包括交易机器人、指标和插件,均由第三方开发者提供,仅供信息参考和技术访问之用。cTrader Store 并非经纪商,不提供投资建议、个人推荐或任何未来业绩保证。
猜您喜欢


价格
注册日期 02/08/2025
39.95M
交易量
115.5K
盈利点数