"VMM Signals Trend Pro" 标识
指标
版本 1.0, Dec 2025
Windows 版、Mac 版
"VMM Signals Trend Pro" 已上传图片
注册日期 28/12/2024
48
免费安装

**Vmm Signal Trend Pro - Indicator for cTrader**


**General Description**

Vmm Signal Trend Pro is an advanced technical analysis indicator for the cTrader platform that detects multiple price patterns in real time. It combines trend detection, candlestick patterns, FVGs (Fair Value Gaps), gaps, and other important patterns into a single visual indicator.


**Main Features**


**1. Trend Detection**

- **Price Action Analysis**: Identifies trends through price action over the last N candles

- **Trend Strength**: Calculates percentage of strength based on momentum and structure

- **Directional Icons**: Green arrow (up) or red arrow (down) when the trend is strong


**2. Detected Patterns**


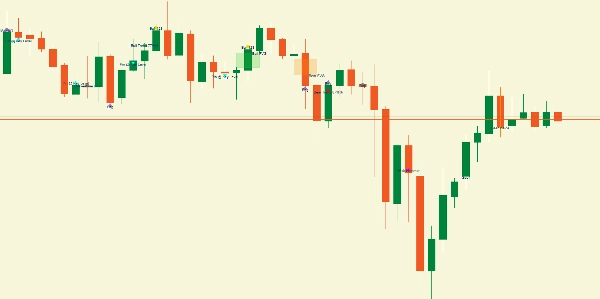
**Fair Value Gap (FVG)**

- **Bullish FVG**: When the current low > the high of 2 candles ago

- **Bearish FVG**: When the current high < the low of 2 candles ago

- **Colored Areas**: Semi-transparent rectangles (green/orange)


**Gaps**

- **Upward Gap**: Opening above the previous high

- **Downward Gap**: Opening below the previous low

- **Visualization**: Small rectangles at the candle opening


**Inside Bars**

- Candle completely within the range of the previous candle

- Differentiation by color (yellow/orange) based on direction


**123 Pattern (Reverse)**

- **Bullish 123 Pattern**: Three points with an upward breakout

- **Bearish 123 Pattern**: Three points with a downward breakout

- **Signaling**: Circular icon Gold


**Wick Patterns**

- **Hammer-like**: Significant lower Wick

- **Shooting Star-like**: Significant upper Wick

- **Icon**: Magenta Star


**Pin Bars**

- Long Wick (≥2x body) with small body

- Detection of nearby key levels

- **Icons**: Up/Down Triangle (cyan)


**Engulfing**

- **Bullish Engulfing**: Bullish candle engulfs previous bearish candle

- **Bearish Engulfing**: Bearish candle engulfs previous bullish candle

- **Icon**: Purple Diamond


**Doji**

- Very small body (≤10% of total range by default)

- Special types: Gravestone, Dragonfly, Long-Legged

- **Icon**: Gray Circle


**3.** Support/Resistance System**

- Automatic detection of swing highs/lows

- Considers proximity to key levels to increase significance


**4. Intelligent Filtering**

- **Limit by Type**: Maximum number of signals per category

- **Time Spacing**: Avoids signals that are too close together

- **Trend Filter**: Option to allow/deny counter-trend signals

- **Minimum Strength**: Filters weak signals


**Configurable Parameters**


**Essentials**

- `Show Trend Direction`: Activates trend arrows

- `Previous Bars Check`: Number of candles for analysis

- `Trend Strength Threshold`: Minimum percentage to consider a strong trend


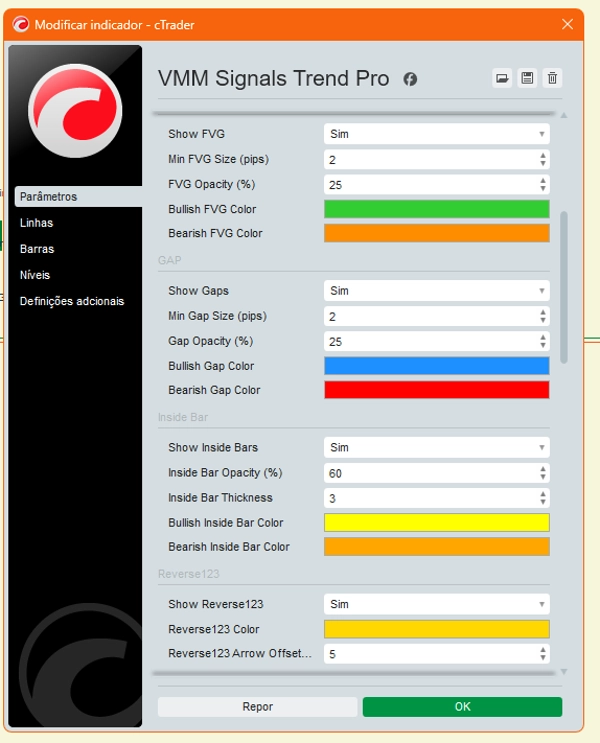
**FVG**


- `Min FVG Size`: Minimum size in pips

- `Opacity`: Transparency of areas

- `Colors`: Customizable colors


**Gaps**


- `Min Gap Size`: Minimum size in pips

- `Colors`: Colors for upward/downward gaps


**Inside Bars**

- `Thickness`: Line thickness


- Opacity: Transparency

- Colors: Differentiated colors by direction


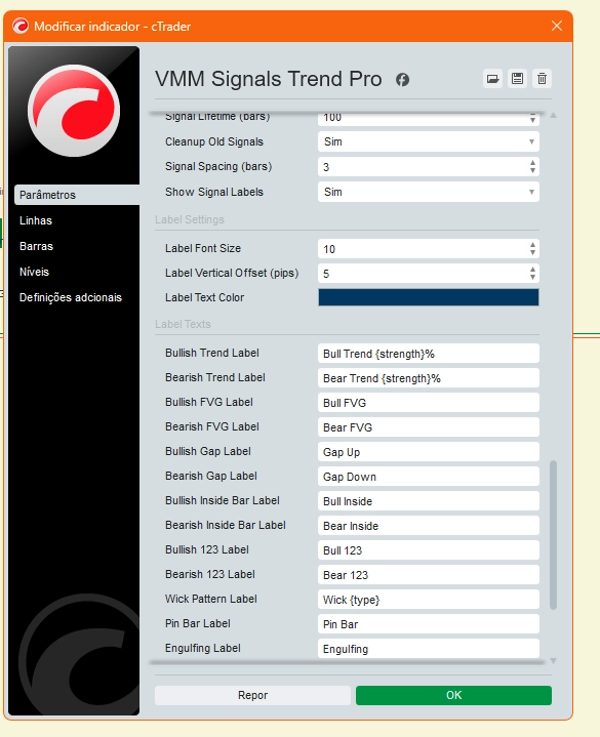
Signals:

- Signal Lifetime: Signal duration (in candles)

- Signal Spacing: Minimum spacing between signals

- Max Signals Per Type: Limit per category


Custom Labels:

- Customizable Text: Each pattern has its own configurable text

- Placeholders: `{strength}` for % strength, `{type}` for specific type

- Formatting: Font size, vertical offset, colors

- Short Mode: Abbreviated labels for dense charts


Internal Mechanics:


1. Trend Analysis:

- Linear Regression: Calculates trend slope

- Candle Count: Bullish vs. Bearish over the last N periods

- Momentum: Considers the magnitude of movements


2. Object Management**

- **Object Cache**: Prevents redrawing existing signals

- **Automatic Cleanup**: Removes old signals based on lifetime

- **Counters by Type**: Controls maximum quantity


**3. **Strength Calculation**

- Each pattern has a specific strength formula

- Based on ratios, pip distances, proximity to key levels

- Range: 0-100%


**Chart Visualization**


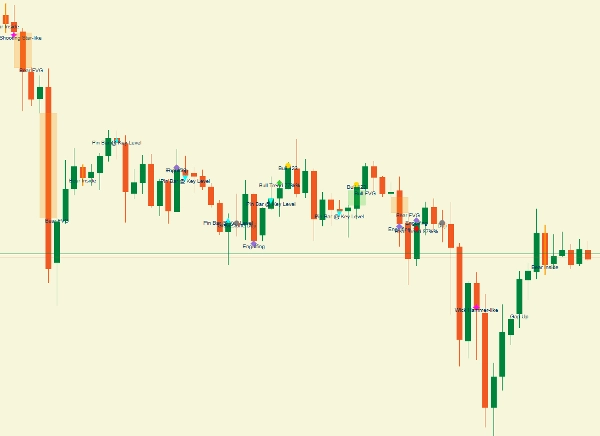
**Chart Elements**

1. **Icons**: Arrows, triangles, circles, diamonds, stars

2. **Areas**: Semi-transparent rectangles (FVG/Gaps)

3. **Lines**: Highlighted inside bars

4. **Labels**: Informative text next to the signals


**Color Code**

- **Green**: Bullish (trend, FVG, gaps)

- **Red/Orange**: Bearish (trend, FVG, gaps)

- **Yellow/Orange**: Inside bars (bullish/bearish)

- **Gold**: 123 pattern

- **Magenta**: Wick patterns

- **Cyan**: Pin bars

- **Purple**: Engulfing

- **Gray**: Doji


**Advantages**


**For Traders**

- **All in one**: Multiple patterns in a single indicator

- **Customizable**: Fine-tuning of each pattern

- **Clear visual**: Intuitive color coding

- **Filtering**: Prevents signal overload


**Use Cases**


**1. Quick Analysis**

- Identify prevailing trend

- Check recent FVGs and gaps

- Detect reversal patterns


**2. Entry Confirmation**

- Combine multiple patterns to increase probability

- Check alignment with trend

- Consider signal strength


**3. Risk Management**

- Identify nearby support/resistance levels

- Use FVGs as areas of interest

- Consider signal spacing


**Limitations**


**Dependencies**


- **Volatile markets**: May generate many signals

- **Timeframes**: Settings may need adjustment per timeframe

- **Assets**: Behavior varies by currency pair


**Considerations**


- **Not predictive**: Past patterns ≠ future guarantee

- **Confirmation required**: Always confirm with additional analysis

- **False signals**: Filters reduce but do not eliminate


**Usage Recommendations**


**Initial Settings**

1. Start with `Smart Filtering = true`

2. Adjust `Min Signal Strength` according to your style

3. Use `Signal Spacing` to avoid overload

4. Customize colors for better visualization


**Effective Combinations**


- **Trend + FVG**: Alignment Strong

- **Inside bar + Key level**: Good entry area

- **Pin bar + Engulfing**: Reversal confirmation

- **123 + Trend**: Probable continuation


**Monitoring**

- Check logs in the console periodically

- Adjust parameters according to the market

- ​​Use in conjunction with other indicators


This indicator is a complete tool for traders seeking comprehensive technical analysis focused on price action and visual patterns, offering total flexibility in customizing and filtering signals.


**⚠️ IMPORTANT DISCLAIMER**


This indicator is a TECHNICAL ANALYSIS TOOL. Generated signals are SUGGESTIONS based on algorithms, NOT investment recommendations. Trading involves significant risk of loss. Past performance does not guarantee future results. The trader bears FULL RESPONSIBILITY for all trading decisions. Always use proper risk management and test on demo accounts before live trading.

指标配置
0.0
评价:0
客户评价
该产品尚无评价。已经试过了?抢先告诉其他人!
BTCUSD
Forex
Signal
Indices
EURUSD
Commodities
GBPUSD
NZDUSD
Scalping
Fair Value Gap
SMC
Crypto
Stocks
XAUUSD
NAS100
USDJPY
cTrader Store 提供的所有产品,包括交易机器人、指标和插件,均由第三方开发者提供,仅供信息参考和技术访问之用。cTrader Store 并非经纪商,不提供投资建议、个人推荐或任何未来业绩保证。

该作者的其他作品

指标
Drawdown Monitor
[ANALYTICAL/INFORMATIONAL] Track NET positions, Break-Even & Drawdown. No order execution.
指标
ATR
VWAP
3 VWAPs (D/W/M) + ATR bands + smart signals. Clean UI, no clutter. Elite precision.
指标
ATR
Support & Resistance
Price information (D/W/M range) + ATR + swap calculator with triple swap detection. Price GPS.
指标
Key Levels
Drawdown Monitor
+1
Real-time position monitor with break-even levels, MTF pivots, profit targets & alerts. Essential risk tool.
指标
ATR
Statistical arbitrage with correlation, triangulation & multi-TF scanner. ATR-based real-time gap triggers.
指标
Support & Resistance
Multi-Timeframe exhaustion indicator. Detects trend loss with Doji filter & dynamic volatility.
指标
Key Levels
Auto-adjusting sessions with holiday intelligence & smart timers, (4 Sessions, 3 Kilzones)
指标
Key Levels
Support & Resistance
6 pivot systems + (LevelPivot by VMM). FULLY customizable: highlight ANY level, hide far levels, YOUR colors, YOUR style

猜您喜欢

指标
AI
ATR
+27
VWAP Sniper Elite -- Institutional Trend Engine
指标
Track VWAP for Asia, London, NY, Sydney, Daily, Weekly, Monthly & Custom Sessions. Perfect for FX & intraday trading!
指标
Key Levels
Drawdown Monitor
+1
Real-time position monitor with break-even levels, MTF pivots, profit targets & alerts. Essential risk tool.
指标
Forex
Signal
Literally the best Linear Regression Indicator out there. 8 distinct mathematical models and more!
指标
Prop
Forex
+13
⚔️Full breakout trading workstation: session box, EP/TP/SL levels, on-chart ✓/✗ outcomes, pro-level analytics and more⚔️
指标
Grid
Prop
+5
Logarithmic Framework by LudwigICT
指标
ATR
CCI
+5
HAI QUANTUM V5.0 | The "Four Horsemen" Edition The Most Advanced Neural-Ready Trading Dashboard for cTrader
指标
BOS
Key Levels
+2
Realtime Trade Adviser will tell you When to BUY and When to SELL. A real time Trade Prompter
指标
AI
ATR
+9
Scalp smarter with DOM Flow Scalper PRO – real-time Bid/Ask imbalance and volume precision!
指标
Forex
EURUSD
+4
This is a tool to help traders open orders/close orders/modify orders quickly with just one click.
指标
AI
ATR
+27
The Fibonacci Automated Levels Indicator is a smart trading tool that automatically detects the most recent market.
指标
ATR
VWAP
3 VWAPs (D/W/M) + ATR bands + smart signals. Clean UI, no clutter. Elite precision.
指标
RSI
Signal
The Wyckoff Toolkit is the ultimate ally for traders seeking to decode the market through the lens of "smart money."
指标
ATR
Statistical arbitrage with correlation, triangulation & multi-TF scanner. ATR-based real-time gap triggers.
指标
ATR
SMC
+20
Session boxes, liquidity sweeps and higher‑timeframe levels for intraday trading
指标
EMA
Forex
+5
ALMA Smoothed Gaussian Moving Average (ASGMA) – by LudwigICT
指标
Support & Resistance
Multi-Timeframe exhaustion indicator. Detects trend loss with Doji filter & dynamic volatility.
指标
ATR
RSI
+5
🚀 HAI QUANTUM v4.0 | The Ultimate Quantum Terminal for cTrader (Smart Money & Algorithmic Trading)
注册日期 28/12/2024
48
免费安装