说明
Previous HLOC – 精准交易的智能高时间框架水平
Previous HLOC 是一个专业的多时间框架指标,能够以无与伦比的清晰度和自定义功能,直接在您的图表上绘制前一周期的高点、低点、开盘价和收盘价水平。
专为 价格行为交易者、剥头皮交易者、日内交易者和波段交易者设计,该指标帮助您即时识别关键机构水平,这些水平通常作为支撑、阻力、拒绝区和流动性目标。
为什么选择 Previous HLOC?
市场始终对前一天、前一周和前一月的水平做出反应。机构、算法和专业交易者密切关注这些水平。
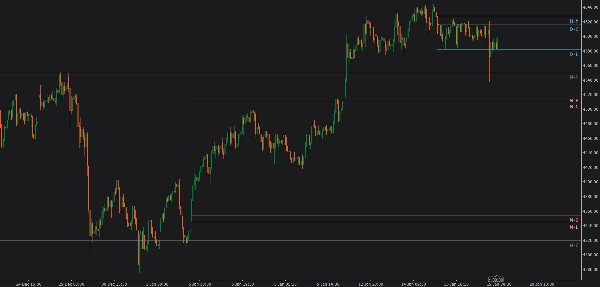
Previous HLOC以简洁、无干扰的方式将这些关键价格呈现在您的图表上——让您永远不会错过它们。
主要特点
✅ 多时间框架水平
- 选择每日、每周、每月或每小时的前一根蜡烛水平
- 无论您的图表时间框架如何,水平始终准确
✅ 完整的 HLOC 控制
- 单独启用或禁用高点、低点、开盘价、收盘价
- 仅交易对您的策略重要的部分
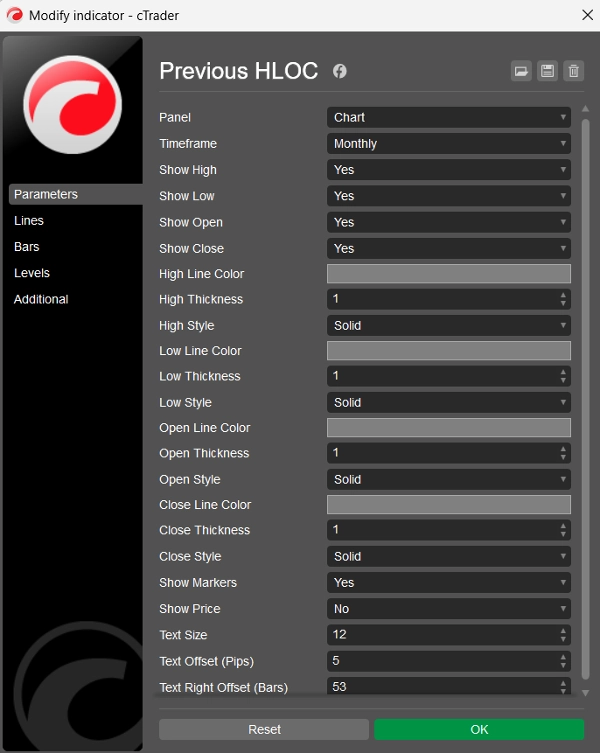
✅ 高级自定义
- 为每个水平分别设置颜色、粗细和线型
- 干净的Consolas 字体标记,文本大小可调
- 可选的价格显示在每个标记旁边
✅ 智能浮动标记
- 标记随图表自然移动
- 滚动时始终与价格水平对齐
- 位置设在右侧,清晰可见
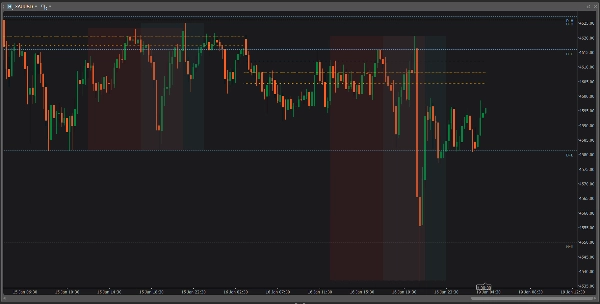
✅ 未来预测水平
- 线条延伸至未来很远
- 非常适合规划入场、出场、止损和止盈水平
🔹 交易者如何使用
📌 识别强劲的日内支撑和阻力
📌 使用前高/低作为流动性扫荡区
📌 交易突破、拒绝和回测
📌 使入场与更高时间框架的偏向对齐
📌 提高风险回报的精准度
🔹 此指标适合谁?
✔ 外汇交易者
✔ 指数和商品交易者
✔ 剥头皮和日内交易者
✔ 波段交易者
✔ 价格行为和 SMC 交易者
🔹 简洁。快速。可靠。
- 无重绘
- 无延迟
- 无杂乱
- 适用于所有品种和所有时间框架
🔹 总结
Previous HLOC 不仅仅是另一个水平指标——它是一个专业交易工具,帮助您以背景、结构和信心进行交易。
如果您围绕前一交易时段水平交易,这个指标应该出现在您的图表上。
摘要
指标配置
客户评价
5.0
评价:2
5 | 100 % | |
4 | 0 % | |
3 | 0 % | |
2 | 0 % | |
1 | 0 % |
客户评价
February 2, 2026
The workspace is easier to scan, but it works better with a written plan.
February 2, 2026
the signal gets compared with context, but it should not replace the chart.
讨论
常见问答
BTCUSD
Forex
Signal
Breakout
Indices
EURUSD
Commodities
GBPUSD
NZDUSD
Prop
Scalping
SMC
Crypto
Stocks
XAUUSD
NAS100
USDJPY
cTrader Store 提供的所有产品,包括交易机器人、指标和插件,均由第三方开发者提供,仅供信息参考和技术访问之用。cTrader Store 并非经纪商,不提供投资建议、个人推荐或任何未来业绩保证。
猜您喜欢


价格
注册日期 23/03/2025