

Description
THE IDEA
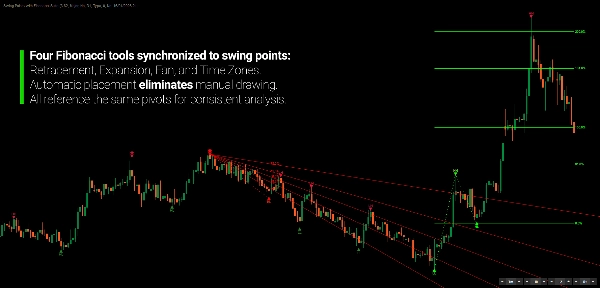
Four Fibonacci tools built from the same automatically detected swing structure instead of relying on separate swing references for each tool.
THE PROBLEM
Fibonacci Retracement, Expansion, Fan, and Time Zones can all be useful ways to examine price movement.
But when each tool uses a different manually selected swing reference, they can end up describing different interpretations of the market.
The problem is not having multiple Fibonacci tools.
The problem is keeping their underlying reference structure consistent.
THE CORE CONCEPT: THE SWING STRUCTURE IS SHARED. THE FIBONACCI VIEWS STAY CONNECTED.
Swing Points with Fibonacci Suite detects the swing structure once and uses that shared swing map as the common structural reference for all four Fibonacci tools. Each tool can still reference the current or previous swing structures independently.
Instead of asking each tool:
“Which swing points should I use?”
the suite establishes one swing map first.
The Fibonacci tools then become different ways of measuring the same underlying price geometry.
One swing structure. Multiple Fibonacci views.
WHAT IT DOES
The indicator automatically detects swing points and uses them as references for:
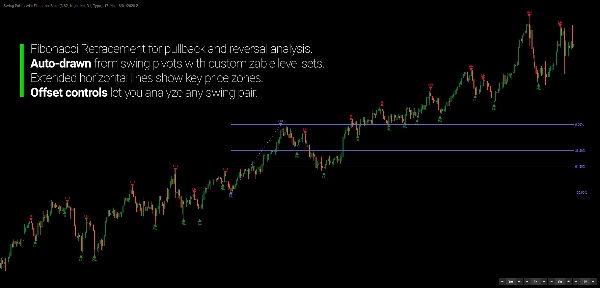
- Fibonacci Retracement
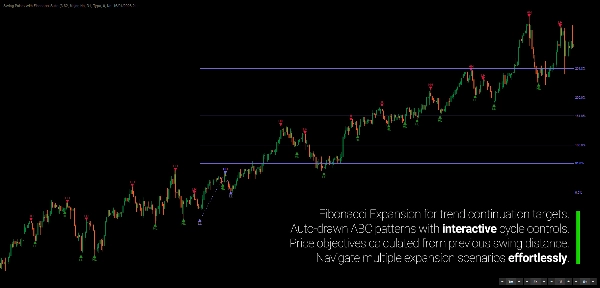
- Fibonacci Expansion
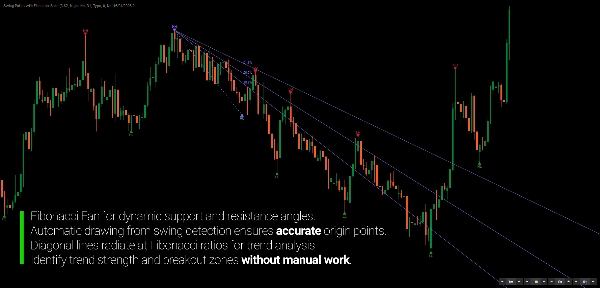
- Fibonacci Fan
- Fibonacci Time Zones
When the swing structure develops, the Fibonacci projections update with it.
This removes the need to manually identify and redraw separate swing references for each Fibonacci tool.
THE SWING COMES FIRST
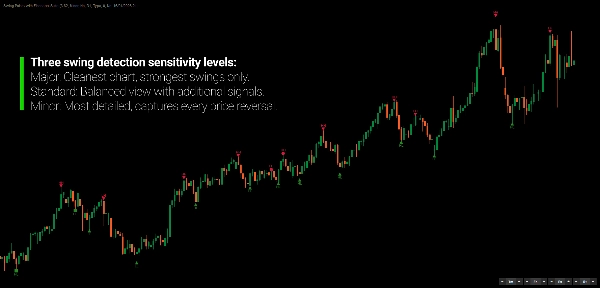
The swing structure is detected using a regression-based swing detection engine.
Three sensitivity levels are available:
- Major
- Standard
- Minor
This allows you to decide how much of the price geometry you want to include in the analysis.
The purpose is not to define one universally correct swing structure.
It is to provide a consistent reference structure for the tools.
FOUR WAYS TO MEASURE THE SAME STRUCTURE
Each Fibonacci tool looks at a different dimension of the same swing map.
Retracement
Measures proportional price movement.
Expansion
Projects price relationships from a three-swing structure.
Fan
Examines diagonal relationships between price and the swing structure.
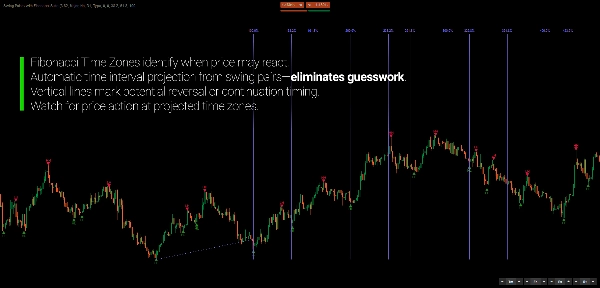
Time Zones
Examines the temporal spacing between important swing points.
The objective is not four separate signals.
It is four different measurements of the same underlying movement.
THE STRUCTURE CAN CHANGE
The market continues to develop after a swing has been identified.
When new highs or lows change the detected swing structure, the Fibonacci projections can update accordingly.
The geometry therefore remains connected to the current swing map instead of becoming permanently attached to an outdated manual reference.
YOU STILL CONTROL THE REFERENCE
Automation does not mean giving up control.
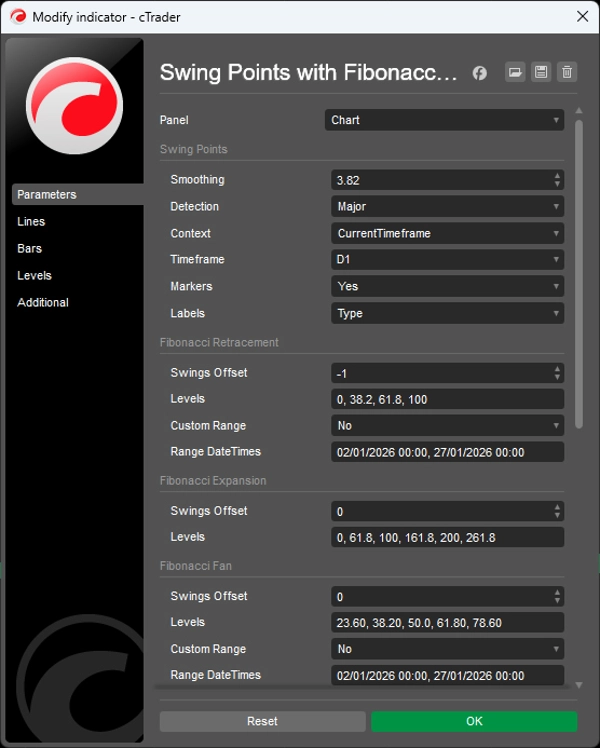
Each Fibonacci tool has an independent reference offset.
- 0 — current structure
- -1 — previous structure
- -2 — two structures back
This allows one tool to examine the current swing while another looks back at an earlier structure.
The swing detection is shared.
The reference selection remains yours.
YOU CAN ALSO DEFINE THE RANGE YOURSELF
Automatic swing detection is the default, but you can override it when you want to study a specific historical range or market event.
Custom Range Mode lets you define the exact start and end points for the Fibonacci analysis instead of relying on detected swing points.
HIGHER-TIMEFRAME FIBONACCI ON YOUR CURRENT CHART
The swing structure can be calculated from a higher timeframe while the Fibonacci geometry is displayed on the current chart.
For example, Daily swings can provide the reference structure while you analyze price movement on an H1 chart.
This makes higher-timeframe price geometry visible without leaving the current timeframe.
SWING INFORMATION WHEN YOU WANT MORE DETAIL
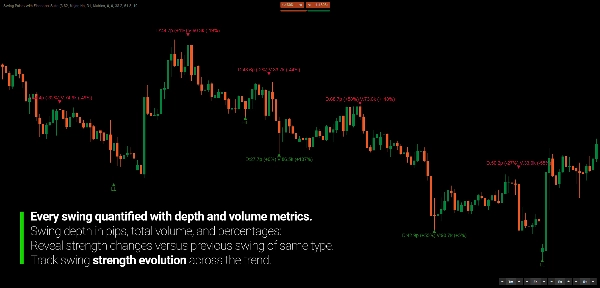
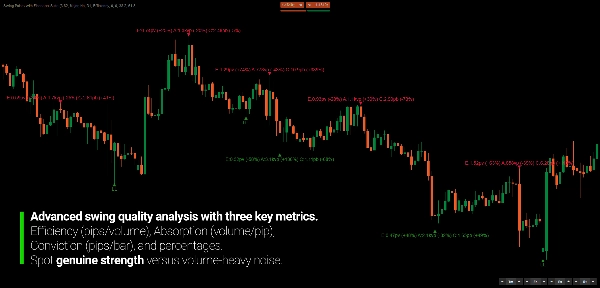
The indicator can also expose additional information about each detected swing, including:
- HH / HL / LH / LL
- Swing depth
- Tick volume
- Swing duration
- Efficiency
- Absorption
- Conviction
- Comparison with previous swings of the same type
These measurements provide additional context around the geometry without changing the underlying swing reference.
READ FIBONACCI AS A MAP, NOT A SIGNAL
Fibonacci levels are reference points.
They do not predict what price must do when it reaches them.
The same level can be observed as part of a retracement, expansion, diagonal relationship, or time projection depending on the tool being used.
The indicator automates the drawing.
You decide what the geometry means.
BUILT FOR STRUCTURAL FIBONACCI ANALYSIS
Designed for traders who already use Fibonacci analysis and want the different tools to remain connected to the same underlying swing structure.
Use it to examine:
- Retracements
- Expansions
- Diagonal relationships
- Time projections
- Swing-to-swing geometry
- Higher-timeframe Fibonacci context
- Multiple historical swing references
KEY FEATURES
- Automatic swing detection
- Regression-based swing engine
- Major / Standard / Minor sensitivity
- Unified swing reference for all tools
- Fibonacci Retracement
- Fibonacci Expansion
- Fibonacci Fan
- Fibonacci Time Zones
- Independent reference offsets
- HH / HL / LH / LL classification
- Swing depth
- Tick volume
- Swing duration
- Efficiency
- Absorption
- Conviction
- Same-type swing comparison
- Higher-timeframe analysis
- Real-time structural updates
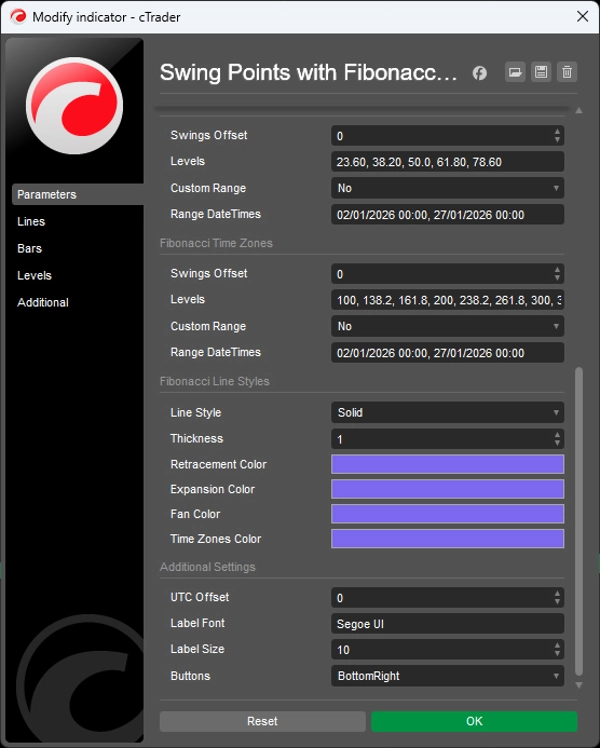
- Customizable Fibonacci levels and display
---
Trading involves risk. This indicator is a technical analysis tool and should be used together with appropriate risk management.
Résumé
All Fibonacci tools are anchored to the same detected swings, ensuring internal consistency and eliminating subjectivity common in manual Fibonacci analysis. Users can adjust which swing pairs drive each tool independently via on-chart controls, and a custom range mode allows manual specification of analysis intervals. Multi-timeframe capability enables detection of swings on higher timeframes while displaying results on lower timeframe charts, providing broader structural context without switching views.
Additional features include swing classification (higher highs, lower lows, etc.) and metrics such as depth, volume, duration, efficiency, absorption, and conviction, supporting detailed market structure analysis. This indicator is designed for traders who use Fibonacci as a structural reference framework, particularly swing and position traders seeking comprehensive, consistent Fibonacci analysis across multiple timeframes.
Avis clients
Discussion
Questions fréquentes
Plus de cet auteur
























Prix