present
Đăng ký và nhận ưu đãi $50 cho lần mua đầu tiên
Trading product for PulseFlow RSI Deep Buyer-Seller Chỉ báo Fibonacci Key Levels, image 1
PulseFlow RSI Deep Buyer-Seller
Chỉ báo
Phiên bản 1.0, Oct 2026
Windows, Mac
Trading product for PulseFlow RSI Deep Buyer-Seller Chỉ báo Fibonacci Key Levels, image 2
Trading product for PulseFlow RSI Deep Buyer-Seller Chỉ báo Fibonacci Key Levels, image 3
Trading product for PulseFlow RSI Deep Buyer-Seller Chỉ báo Fibonacci Key Levels, image 4
Kể từ 14/10/2026

Mô tả

Launch price: $19 until November 14, 2026. After that date, the price returns to $33.

Price keeps moving. Is momentum keeping up?


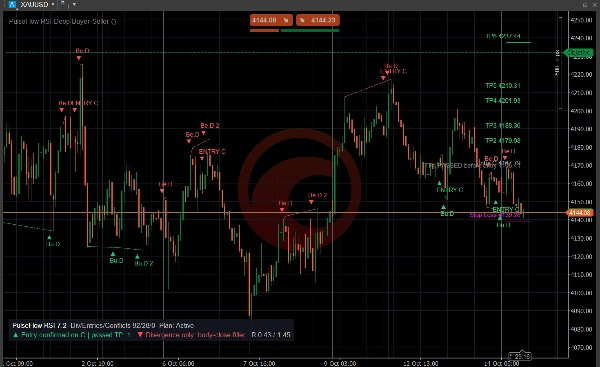
PulseFlow RSI Deep Buyer-Seller shows you when momentum stops confirming price. It marks RSI divergences directly on your chart, so you can recognize potential momentum shifts at a glance and plan your next move with clear references. It helps you make better decisions with more context.


From observation to a trade plan

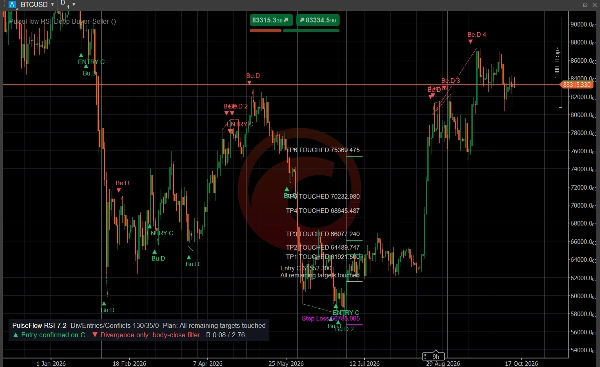
- Bullish (Bu.D) and bearish (Be.D) divergence markers, with a dashed line from the origin to the endpoint of each divergence.

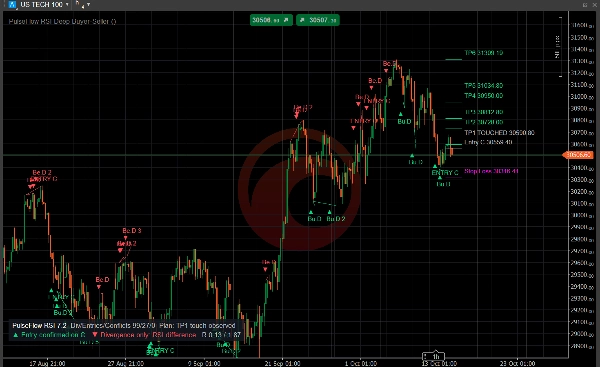
- Divergences that pass your entry filters are marked ENTRY C and get a full plan: entry reference, stop and six price targets.

- Targets already passed before the entry are shown in grey, and targets touched afterwards are labelled on the chart.


A chart that adapts to you

- Adjust RSI settings, entry filters, stop and target levels, colors and line length.

- Optional overbought and oversold markers, and optional markers for divergences that do not qualify as entries.

- A compact status panel at the bottom-left keeps the latest decision in view without covering the chart.


The latest plan in view

By default, only the latest qualified entry levels are shown. Enable historical trade levels in the settings to review previous setups.


Alerts

Optional cTrader pop-up alerts for new entries, new divergences, stop and target touches, and expired plans.


Type, instruments and timeframes

Chart overlay indicator for momentum and divergence analysis. It is designed for cryptocurrencies, stock indices, metals such as gold, and other non-forex markets, on H1 and higher timeframes. On forex pairs and below H1 it is less reliable. Markers and plans are drawn once the confirming bar has closed, at the open of the next bar.


Use it to organize your analysis and assess opportunities with clear references. The indicator does not open or manage trades. Trading involves risk. Past performance does not guarantee future results.


Tóm tắt

Hồ sơ chỉ báo
Danh mục chỉ báo
Động lượng
Loại đầu ra
Hình ảnh trực quan
Tín hiệu
Yêu cầu dữ liệu
Chỉ dữ liệu nến
Tín hiệu được hỗ trợ
Phân kỳ
Đảo chiều
Chạm ngưỡng

Thảo luận

Đánh giá của khách hàng

0.0
Đánh giá: 0
Đánh giá của khách hàng
Sản phẩm này chưa có đánh giá nào. Bạn đã dùng thử chưa? Hãy là người đầu tiên chia sẻ với mọi người!

Câu hỏi thường gặp

Fibonacci
Key Levels
RSI
Các sản phẩm có sẵn trên cTrader Store, bao gồm bot giao dịch, chỉ báo và plugin, được cung cấp bởi các nhà phát triển bên thứ ba và chỉ nhằm mục đích cung cấp thông tin và tiếp cận kỹ thuật. cTrader Store không phải là nhà môi giới và không cung cấp lời khuyên đầu tư, khuyến nghị cá nhân hay bất kỳ đảm bảo nào về hiệu suất trong tương lai.

Sản phẩm khác của tác giả này

Chỉ báo
Key Levels
Market Structure
+1
See the day's percentage targets from the open, so you know where the session stands at a glance.
Chỉ báo
Imbalance
Key Levels
+1
Keep open imbalance zones, untouched session highs and lows and the day's ADR range in view, without scrolling back.
Chỉ báo
Key Levels
Support & Resistance
Add your provider's gamma levels by hand or automatically with our feed plugin, and see the gamma regime at a glance.
Plugin cho máy tính
External Data
HTTP Requests
Load live gamma levels from your own QuantWheel API key into PulseFlow Gamma Regime, with no more typing by hand.

Bạn cũng có thể thích

Logo "Titan Pro"
Phổ biến
4.3
(3)
$19
Chỉ báo
ATR
MACD
+15
Professional trading indicator: 5 cloud types, 9 ML engines, SMC Order Blocks, Pandas-TA & live dashboard.
Chỉ báo
Moving Average
An Indicator made for scalping. Shows you the Sniper movement on Chart with the colour signals.
Chỉ báo
Prop
Forex
+4
Draws pivots (P, S/R, CPR) from selected anchors like H1–Month1, with optional mid-levels (PS1, S1S2, etc.)
Chỉ báo
Forex
BTCUSD
+10
Enhance trading with TSI! Use the True Strength Index for clear insights into market momentum and trend strength.
Chỉ báo
Forex
BTCUSD
+10
6-stage IIR filter trend indicator with colored line segments, reversal signals, alerts, and entry arrows.
Logo "ProVWAP"
Phổ biến
4.4
(5)
$19
/
$20
Chỉ báo
ATR
RSI
+5
Advanced Anchored VWAP for cTrader: volatility bands, real‑time alerts & customizable session resets.
Chỉ báo
RSI
SMC
+4
High Low Divergence is a clean, overlay indicator that automatically identifies swing highs and swing lows
Chỉ báo
ATR
EMA
+5
Candle timer with live profit tracking on chart – displays pips, currency value, and percentage in real time.
Chỉ báo
VWAP
Forex
+12
Unlock VWAP in cTrader! Choose anchor periods, price sources, and display deviation bands with real-time tick updates.
Chỉ báo
AI
ATR
+26
SMC without the mess: Clean structure + auto-managing FVGs + MTF panel. Hard-right-edge, step size-based for any symbol.
Chỉ báo
VWAP
Support & Resistance
Trading.FC$_vwap Algo shows VWAP trends, dynamic support/resistance and deviation bands to spot potential trade entries.
Chỉ báo
MACD
Prop
+14
Customize the MACD! Choose colors, get real-time tick updates, and see crossover points for enhanced trading precision.
Chỉ báo
BOS
EMA
+5
VWAP Bands indicator with 3 standard deviation levels, buy/sell zones, and a draggable ON/OFF button to toggle the entir
Chỉ báo
SMC
Prop
+14
BoS ChoCH Pro,Strict Mode,False Breakout Filter,Average hit rate: 72-78%
Chỉ báo
AI
Prop
+9
A cutting‑edge trading indicator that fuses AI and mathematics with adaptive logic to classify market regimes.
Chỉ báo
Drawdown Monitor
Protect your funded account. Real-time Daily Equity Drawdown monitor with Green / Orange / Red flashing alerts.
Chỉ báo
RSI
Breakout
+1
"Identify key market zones and visualize support/resistance from multiple timeframes on a single chart.
Chỉ báo
Indices
Commodities
The Advanced CCI & EMA Indicator combines the CCI with 40 & 80 EMA logic to generate precise arrows signaling direction

Giá

Kể từ 14/10/2026